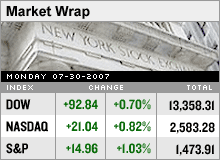
The bleeding stops on Wall StreetStocks bounce back after last week's selloff as credit market fears subside and helped by some deal making activity.NEW YORK (CNNMoney.com) -- Last week's stock market selloff came to an end Monday with major gauges finishing higher, helped by cooling credit markets fears and a bit of deal making on Wall Street. The Dow Jones industrial average (up 92.84 to 13,358.31, Charts) climbed by as much as 131 points, before paring some gains and finishing 92 points, or 0.7 percent higher. The broader S&P 500 (up 14.96 to 1,473.91, Charts) surged 1 percent higher, while Nasdaq composite index (up 21.04 to 2,583.28, Charts) closed up 0.8 percent. Stocks struggled at the start of Monday's session, but moved higher after Wall Street's recent fears about the housing and credit markets subsided. "A number of brokerage firms and economic strategists have reached the conclusion that the problems in the credit market do not imply that the economy and earnings are going to go into a tailspin ," said Hugh Johnson, chief strategist for ThomasLloyd Global Asset Management. Finance firm GMAC helped offset those concerns by reporting that it had trimmed its exposure to the subprime mortgage fallout, reporting a narrower quarterly loss. Credit and housing market worries sent global stock markets tumbling last week, with the 30-stock Dow industrials falling 585 points, posting its biggest weekly percentage decline since March 2003. Investors have worried that tougher conditions in credit markets could raise the cost of borrowing for companies, hurting corporate earnings and slow the buyout boom, which has helped prop up stock prices. A handful of deals on Wall Street also helped provide some bullish momentum for the battered stock market. Diversified manufacturer Ingersoll-Rand (up $3.63 to $51.77, Charts) said Monday it would sell its Bobcat unit for $4.9 billion to a South Korean firm. Verizon Communications' (down $0.49 to $41.51, Charts, Fortune 500) wireless division, a joint venture with Vodafone Group (down $0.21 to $30.43, Charts), also announced it would purchase Rural Cellular (up $10.95 to $42.76, Charts) for $757 million, sending shares of the smaller carrier nearly 34 percent higher on the Nasdaq. In related news, Verizon also reported improved earnings that met forecasts Monday. Also on the earnings front, Sun Microsystems Inc., which produces computer servers, reported better-than expected earnings and sales that were in line with projections. Sun (down $0.03 to $4.89, Charts, Fortune 500) shares climbed 9 percent in after-hours trade. RadioShack (down $3.25 to $25.55, Charts, Fortune 500) booked better-than expected profits, but disappointing sales sent shares of the consumer electronics retailer nearly 11 percent lower on the New York Stock Exchange. A number of companies are set to report quarterly results Tuesday including General Motors (Charts, Fortune 500) before the opening bell and Whole Foods (Charts, Fortune 500), which will post results after the market close. In corporate news, shares of Dow Jones (down $2.89 to $51.56, Charts) sank nearly 6 percent Monday after a spokesperson for News Corp. (up $0.18 to $22.84, Charts, Fortune 500) said the company may no longer proceed with its $5 billion bid for the Wall Street Journal publisher it if does not receive more support from the Bancroft family, which holds a controlling stake in the company. Shares of American Home Mortgage Investment (up $0.00 to $10.47, Charts) tumbled in premarket trade and did not resume trading Monday after the mortgage lender announced that its banks are demanding it put up more cash after writing down the value its loan and security portfolios significantly. On a sector basis, the Amex Gold Bugs index rose about 2.8 percent, while the Amex Oil index added 1.7 percent, and the Amex Natural Gas index climbed 1.3 percent. The Chicago Board Options Exchange's Volatility Index, or VIX (down $3.30 to $20.87, Charts), an indicator of market volatility that traders follow, fell nearly 13 percent Monday after closing at its highest level in more than four years on Friday. The VIX and the market tend to move in opposite directions. Market breadth was positive. Winners beat losers by 5 to 3 on the New York Stock Exchange on volume of 2.03 billion shares. Advancers topped decliners by more than 3 to 2 on volume of 2.33 billion shares. After a session with no major economic reading, Wall Street will have plenty of reports to sift through Tuesday including the Conference Board's July reading on consumer confidence, and construction spending for June. Treasury prices fell, lifting the yield on the 10-year note to 4.80 percent from the 4.77 percent level reached after bonds rallied Friday in reaction to the selloff in equities. Oil prices fell with U.S. light crude for September easing 22 cents at $76.80 a barrel on the New York Mercantile Exchange. The dollar was lower against the euro and gained versus the yen. COMEX gold for December gained $4.30 to $676.60 an ounce. |
|


