Stocks dip, but it's still a winning quarter
Wall Street retreats on weaker-than-expected consumer confidence report, falling oil prices and stocks.

NEW YORK (CNNMoney.com) -- Stocks slipped Tuesday, at the end of the S&P 500's best quarter in more than a decade, with a weaker-than-expected consumer confidence report and a slump in oil prices sparking the selloff.
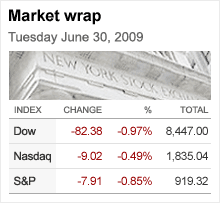
The Dow Jones industrial average (INDU) fell 82 points, or 0.9%. The S&P 500 (SPX) index lost 8 points, or 0.9%, and the Nasdaq (COMP) gave up 9 points, or 0.5%.
Stocks gained Monday as investors scooped up shares hit in the recent selloff. But the advance petered out Tuesday at the end of a strong quarter on Wall Street. The S&P 500 gained 15.2% in the April through June period for its best quarter since the final three months of 1998.
Tuesday brought a reading that showed consumer confidence slipped in June after rising in the last two months. That setback was weighing on stocks, said John Wilson, chief technical strategist at Morgan Keegan. But the weakness was also part of a broader pullback after the spring rally.
The S&P 500 surged 40% after bouncing off 12-year lows hit March 9. But in the last two weeks, stocks have fallen modestly as investors have worried that the market got ahead of any economic improvement.
"The path of least resistance appears to be up, but I see no new catalyst," Wilson said.
He said that it's possible that the second-quarter results, which start pouring in later in July, could give the market a lift -- particularly if the banks, techs or homebuilders have something good to say.
Other than that, "I would not be surprised to see stocks continue to consolidate sideways in the third quarter and then ramp up again in the fourth quarter," he said.
Strong quarter: The Dow gained 11% this quarter, posting its best three-month period since the second quarter of 2003. The Nasdaq has gained 20% and is on track to post its best quarter since the second of 2003.
But weakness in the first quarter means first half of 2009 results are less upbeat. The Dow is down 3.8%, the S&P is up 1.7% and the Nasdaq is up 16.4%.
Economic reports : The June Consumer Confidence index from the Conference Board fell to 49.3 from a revised 54.8 in May, versus forecasts for a rise to 55.3.
The S&P/Case Shiller 20-city home price index fell 18.1% in April from a year ago versus forecasts for a drop of 18.6%.
But on a month-over-month basis, the index showed some improvement. Prices fell 0.6% versus March, after posting a 2.2% drop in the previous month.
The Chicago PMI, a regional read on manufacturing, rose to 39.9 in June from 34.9 in May. Economists thought it would rise to 39.
A slew of reports are jammed in to the remaining days of the holiday-shortened trading week.
Wednesday brings a report on June private-sector employment from payroll services firm ADP, a precursor to Thursday's more closely watched government jobs report.
The pending home sales index from the National Association of Realtors and the Institute for Supply Management's June manufacturing index are also due Wednesday. Other reports on tap include May construction spending and June auto and truck sales.
In addition to the monthly jobs report, Thursday brings readings on factory orders and weekly jobless claims.
All financial markets are closed Friday for the Independence Day holiday.
Oil and the dollar: Strength in the greenback dragged on oil and other dollar-traded commodities.
In currency trading, the dollar rallied versus the euro and the yen.
U.S. light crude oil for August delivery fell $1.60 to settle at $69.89 a barrel on the New York Mercantile Exchange.
That dragged on big oil services stocks, including Dow components Chevron (CVX, Fortune 500) and Exxon Mobil (XOM, Fortune 500). Other Dow stock losers included Procter & Gamble (PG, Fortune 500), Caterpillar (CAT, Fortune 500) and IBM (IBM, Fortune 500).
Bonds: Treasury prices slipped, raising the yield on the benchmark 10-year note to 3.51% from 3.47% Friday. Treasury prices and yields move in opposite directions.
Other markets: In global trade, Asian and European markets ended mixed.
COMEX gold for August delivery fell $13.60 to settle at $927.40 an ounce.
Market breadth was negative. On the New York Stock Exchange, losers beat winners three to two on volume of 1.33 billion shares. On the Nasdaq, decliners topped advancers five to four on volume of 2.12 billion shares. ![]()
Michael Jackson concert tickets to be refunded
Top 10 moments in Steve Jobs' career
Wall Street's selective memory
10 best stocks for 2009
Prison survival tips for Madoff
Thirtysomethings poised to give housing a pop
The 2009 Fortune 500
The Great Recession
50 years of profit swings


