Oil's record high, one year later
Crude is less than half its $145 peak of last July 3 - as a global economic slowdown zaps demand.

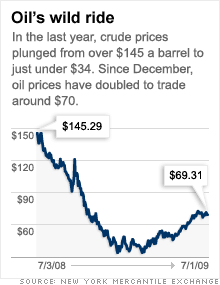
NEW YORK (CNNMoney.com) -- One year ago, on July 3, 2008, oil prices settled at a record high -- a once-unthinkable $145.29 a barrel
On Thursday, it settled at $66.73, less than half the record price, following a $2.58 decline.
In between, a global demand surge morphed into a global economic slowdown -- one that would drive the price of oil as low as $33.87 in December -- followed by the partial recovery that has been underway since.
A year ago, oil was driven higher by two factors. One was the emergence of new global economic powers such as China, India and Russia, competing with the United States and the West for the world's oil. The other was a weak dollar, the currency of crude trading.
"Last year, we had a very weak dollar at the same time that we had very strong demand, insatiable demand," said James Cordier, founder of OptionSellers.com, a commodity brokerage.
But first, the high oil prices led to a curb in that demand. Then, weakness in the housing market and instability in the banking sector following the collapse of Lehman Brothers began to weigh on the world's economies -- particularly in the United States, the world's biggest oil consumer.
Confidence shriveled, and investors pulled cash out of assets that involved risk -- such as oil and stocks -- and moved cash into the safe haven of Treasury debt.
Oil and Wall Street: Oil prices and stocks have moved in tandem since last fall, dragging each other lower and then helping each other higher.
From July 3 to Dec. 19, the S&P 500 fell 30%. But in the same period, oil prices sank 77%.
The S&P 500 and the Dow Jones industrial average fell to 12-year lows on March 9. Between then and June 11 -- the recent peak for stocks -- the S&P 500 gained 43%. The rally in stocks has since stalled.
Oil prices, while they fell harder in the fall, also bounced back stronger than Wall Street. Crude futures doubled, topping $70 a barrel in early June. In recent sessions, oil's run-up has taken a breather, just as Wall Street has.
The reason that oil price swings are more extreme than the swings in the stock market is due to the heavy participation in the oil market by speculators, according to Cordier.
"We have oil supplies at a 20-year high at a time when demand is falling at the fastest pace on record," said Cordier. Based on supply and demand, oil should likely still be hovering closer to the yearly low around $33 a barrel, he said.
Since taking office in January, the Obama administration has been spending at an unprecedented clip to stimulate the economy. Optimism about a boost in demand pushed oil prices.
"This (recent) rally to $75 was extremely speculative," said Cordier. "It was based on green shoots -- it was based on feeling that the economy was going to recover."
Dollar weighs in: Crude is a dollar-denominated commodity. When the dollar weakens against other currencies, the price of crude goes up.
Last year, the rally in crude was supported by a weak dollar. A weak dollar helped oil recovered from its lows in December, too. But oil prices only climbed half as high in the front half of 2009 as in the first six months of 2008.
"This year, we have a weak dollar, but we don't have any demand," Cordier said.
He expects the recent rally in the price of oil to lose its legs.
"When headlines read in August or September that unemployment hit 10%, that will be a shock to the investors' system and then oil will start to trade on its fundamentals -- and that will be in the $50 to $55 range," Cordier said.
On Friday, the government reported that the unemployment rate increased to 9.5% in June.
Gasoline: Gasoline prices have risen along with oil. But the record for a gallon of $4.114 was set two weeks after the crude mark, on July 17, according to the daily survey conducted for motorist group AAA.
On Friday, the national average fell 0.1 cent to $2.629 a gallon -- about a dollar above its recent lows set at the start of the year. ![]()


