Search News

FORTUNE -- If we have learned anything in the last few years, it's that all major markets are connected. The subprime crisis in the United States -- the classic example -- roiled almost all global markets across asset classes in 2007 and 2008. This became apparent again today, when China allowed the renminbi to appreciate nearly to an all-time high against the U.S. dollar, with every indication it would continue to allow the currency to adjust closer to its market value. Stocks rose around the world in response, though only modestly.
Despite the Chinese surprise, this year's consensus global risk factor is still European sovereign debt and the risk of defaults. It's too soon to expect a global sovereign debt unwind, as the problem still appears to be primarily specific to Europe. Nonetheless, the crisis is already showing global implications, especially in trade.
By all appearances, Chinese exports are healthy: Chinese figures for May, 2010, show a 48.5% increase over the same period the previous year. Exports to the 27-nation European Union, China's largest importer, rose 34.4% in this period to $25.9 billion -- 20% of total Chinese exports. The data seems to suggest that sovereign debt issues had a negligible impact on global commerce; what problems existed were specific to troubled countries within the European Union.
Exports: A rear window
But exports, like many economic indicators, often measure the past rather than the present. According to the Chinese Ministry of Commerce, Chinese companies typically take two months or so to fulfill orders. Therefore the May export number actually reflects orders from March, which predates the European sovereign-debt slowdown. Company earnings announcements and government economic releases also rarely offer real-time data, let alone leading indicators. But an economy's liquidity, measurable by a banking system's willingness to lend, can supply an immediate picture of economic growth.
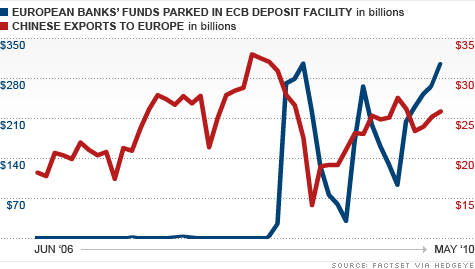
The conversation about European liquidity has focused on European Central Bank overnight deposit facility usage. As outlined in the chart above, in lieu of lending to each other, European banks are choosing to deposit funds with the European Central Bank at record levels. That is, European banks would rather deposit funds with the ECB at just 0.25% rather than lend to other banks at higher rates. No fact illustrates the European ailment better. European banks are so concerned about the creditworthiness of banks holding European sovereign debt that they're choosing security over profit.
What does this have to do with China? Very simply, the less banks lend to each other, the less they go on to lend to consumers and businesses. The money piling up in the ECB deposit facility is money that isn't circulating in the economy and supporting commerce, such as the import of Chinese goods.
The attached chart compares deposits in the ECB facility to Chinese exports. Deposits suddenly spiked to $210 billion in November, 2008, a ten-fold increase over the previous month -- a sharp indicator of declining intra-bank lending and overall liquidity due to the global financial crisis coming to a head. Within four months, Chinese exports to Europe were nearly half what they had been. As European orders for Chinese goods slowed, so did the demand for raw inputs. Think oil, copper, steel, plastic, most basic materials, and the multiple on the Chinese stock market. The bottoming out of oil prices in February 2009 -- the same month, as noted above, that year-over-year Chinese exports to the European Union declined the most -- was no coincidence. Looking at the chart again, the data for May 2010 shows ECB deposits exceeding even those of November 2008 (the previous spike on the chart). This means those solid-looking Chinese numbers may not be solid for long.
While the full implications of the sovereign debt crisis on European liquidity remain unclear, there can be no argument about global economic interconnectedness. To think that European sovereign debt is an isolated issue, as some economists have argued, is naïve at best.
-- Daryl G. Jones is the Managing Director of Risk Management at Hedgeye, a research firm based in New Haven, Conn. His colleague Darius Dale also contributed to this column. ![]()


| Company | Price | Change | % Change |
|---|---|---|---|
| Ford Motor Co | 8.29 | 0.05 | 0.61% |
| Advanced Micro Devic... | 54.59 | 0.70 | 1.30% |
| Cisco Systems Inc | 47.49 | -2.44 | -4.89% |
| General Electric Co | 13.00 | -0.16 | -1.22% |
| Kraft Heinz Co | 27.84 | -2.20 | -7.32% |
| Index | Last | Change | % Change |
|---|---|---|---|
| Dow | 32,627.97 | -234.33 | -0.71% |
| Nasdaq | 13,215.24 | 99.07 | 0.76% |
| S&P 500 | 3,913.10 | -2.36 | -0.06% |
| Treasuries | 1.73 | 0.00 | 0.12% |
|
Bankrupt toy retailer tells bankruptcy court it is looking at possibly reviving the Toys 'R' Us and Babies 'R' Us brands. More |
Land O'Lakes CEO Beth Ford charts her career path, from her first job to becoming the first openly gay CEO at a Fortune 500 company in an interview with CNN's Boss Files. More |
Honda and General Motors are creating a new generation of fully autonomous vehicles. More |
In 1998, Ntsiki Biyela won a scholarship to study wine making. Now she's about to launch her own brand. More |
Whether you hedge inflation or look for a return that outpaces inflation, here's how to prepare. More |