Search News

NEW YORK (Money) -- I'm 31 years old. Is there a benchmark established to indicate where I should be financially at my age? What ratio should my investments be relative to income and how much I should be investing? -- C. Henry, Las Vegas.
If you were driving across the country, you'd probably plan to hit specific cities by certain days. After all, you wouldn't want to wake up in Chicago only to realize you have to be in L.A. later that day.
Retirement planning is a journey too, so the same concept applies. Once you have a retirement goal in mind, you want to be able to refer to benchmarks along the way to see how you're doing. Otherwise, you could find yourself at the end of your career well short of the savings you'll need.
The best yardstick is the size of your nest egg relative to your income. To quit working at 65 with a decent shot at replacing 80% of your pre-retirement earnings, you'll need savings equal to roughly 12 times your income (that assumes you'll collect Social Security but no pension).
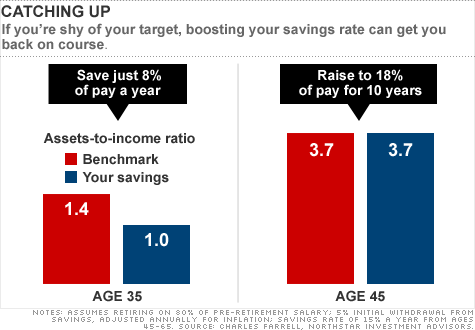
Along the way, says financial planner Charles Farrell, author of Your Money Ratios: 8 Simple Tools for Financial Security, you should aim to hit these milestones: By 35 you should have 1.4 times your pay tucked away. That ratio is 3.7 at 45, and 7.1 at 55. (Calculator: Are you saving enough?)
Farrell's math assumes you save 12% to 15% of your salary a year, including matches, and that your investments beat inflation by 4.5 percentage points a year.
I imagine some of you are now saying, "Whoa. Am I doomed to a grim retirement?"
No. Falling short of these figures isn't necessarily cause for alarm. Ratcheting up your savings rate may be enough to make up for lost ground. Granted, that requires a concerted effort. But once you've caught up, you can ease back to a savings rate of 15% of pay.
Even if you can't catch up, you needn't despair. There isn't a single path to one retirement destination. By living on 70% of your salary or working a few more years, you can cut the savings levels you must reach by 10% to 25%.
Of course, life doesn't necessarily work out so neatly that you can consistently hit any series of savings targets. More likely your income and expenses will have ups and downs throughout your career, so that you fall behind in lean times but have the opportunity to catch up when you're flush.
By checking in periodically at an online tool like T. Rowe Price's Retirement Income Calculator, you'll be able to gauge where you stand now, and see what you need to do to stay or get back on track.
As with any long journey, by plotting a course carefully, checking the map often, and making adjustments as you go, you'll increase your odds of reaching retirement on schedule. ![]()

Carlos Rodriguez is trying to rid himself of $15,000 in credit card debt, while paying his mortgage and saving for his son's college education.
| Overnight Avg Rate | Latest | Change | Last Week |
|---|---|---|---|
| 30 yr fixed | 3.80% | 3.88% | |
| 15 yr fixed | 3.20% | 3.23% | |
| 5/1 ARM | 3.84% | 3.88% | |
| 30 yr refi | 3.82% | 3.93% | |
| 15 yr refi | 3.20% | 3.23% |
Today's featured rates: