Click chart for more bonds data.
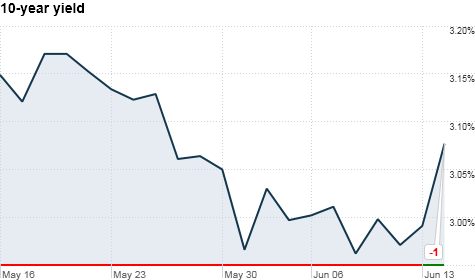
NEW YORK (CNNMoney) -- Treasuries sold off Tuesday in the wake of better-than-expected retail sales and manufacturing data, pushing the benchmark 10-year yield to its highest level since late May.
Government reports on retail sales and manufacturing inflation were the first economic data investors have seen this week.
The Commerce Department said retail sales slid 0.2% in May. While it was the first decline in 11 months, the report still was much better than expected.
And the Labor Department issued a brighter report on the producer price index. The PPI rose 0.2% in May, a slightly more than the 0.1% that economists had forecast.
The reports sparked a rally in stocks, while both short- and long-term Treasuries took a dive. By the close of trading, the 10-year yield was 3.10%, its highest level since May 26. Bond yields and prices move in opposite directions.
"We've seen equities humbled for the last six weeks or so," said Kim Rupert, a fixed income analyst with Action Economics. "A lot of that money had gone into Treasuries, and today is to some extent, an unwind."
Meanwhile, investors got some good news about the Chinese economy, which put additional downward pressure on safe-haven Treasuries.
The country released a report on industrial production that beat expectations and said inflation picked up in May -- easing worries about a hard landing for the struggling giant.
Rupert said that the day's economic data worked to relieve some of the fears about a true double-dip recession, but said that a few major fears -- the debt ceiling and Greece's fiscal troubles -- still weigh on investors minds.
What yields are doing: The 30-year yield jumped to 4.30%, the 2-year yield moved higher to 0.45%, and the 5-year yield increased to 1.69%.
The 10-year note's yield was at 3.10% in midday trade, up from 2.98% late Monday. ![]()
| Index | Last | Change | % Change |
|---|---|---|---|
| Dow | 32,627.97 | -234.33 | -0.71% |
| Nasdaq | 13,215.24 | 99.07 | 0.76% |
| S&P 500 | 3,913.10 | -2.36 | -0.06% |
| Treasuries | 1.73 | 0.00 | 0.12% |
| Company | Price | Change | % Change |
|---|---|---|---|
| Ford Motor Co | 8.29 | 0.05 | 0.61% |
| Advanced Micro Devic... | 54.59 | 0.70 | 1.30% |
| Cisco Systems Inc | 47.49 | -2.44 | -4.89% |
| General Electric Co | 13.00 | -0.16 | -1.22% |
| Kraft Heinz Co | 27.84 | -2.20 | -7.32% |
| Overnight Avg Rate | Latest | Change | Last Week |
|---|---|---|---|
| 30 yr fixed | 3.80% | 3.88% | |
| 15 yr fixed | 3.20% | 3.23% | |
| 5/1 ARM | 3.84% | 3.88% | |
| 30 yr refi | 3.82% | 3.93% | |
| 15 yr refi | 3.20% | 3.23% |
Today's featured rates:

