Search News

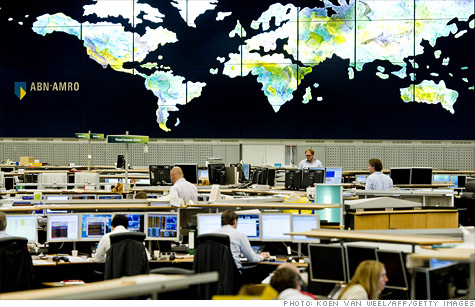
Traders in the dealing room of the ABN AMRO bank in Amsterdam, watch global transactions on August 8, 2011.
NEW YORK (CNNMoney) -- As they cope with the market's twists and turns, investors are finding comfort in a new kind of security blanket: emerging market bonds.
Typically, investors shun these riskier investments during times of uncertainty in favor of "safer" assets like gold and U.S. Treasuries. But that has started to change.
During the weeks of heightened market volatility in early August, bonds issued in local currencies of emerging markets were the only "risky" asset class to attract investors, according to data from EPFR Global and the Royal Bank of Scotland (RBS).
And that resulted in yields for both U.S. Treasuries and emerging market bonds to move in "lockstep," said Joe Portera, co-portfolio manager of the Hartford Strategic Income Fund (HSNAX).
"It's a pretty interesting change in dynamic," he said. "Investors aren't flying out of that market as they would have been in the past, and that tells you something about the market's perception of emerging market debt -- it's starting to trade more like investment-grade debt."
One reason emerging market bonds are gaining "safe haven status" is because investors are recognizing that there's a difference between the debt problems of Europe and the United States, and healthier emerging market economies, said Demetrios Efstathiou, RBS fixed income analyst.
For example, the amount of debt saddling some of the world's largest and most developed economies -- like the United States, United Kingdom and France -- is more than 70% of their gross domestic product, according to the International Monetary Fund.
That compares to a debt-to-GDP ratio of less than 40% for emerging market economies, including Brazil and Mexico -- the top two debt issuers among developing countries.
"The credit quality in emerging markets has really improved during the last decade, and the risk of default is fairly low, especially if you're invested in a broad basket of emerging market funds," said Anthony Valeri, fixed income strategist with LPL Financial.
Despite that progress, Valeri wouldn't go so far to call emerging market bond funds "the new Treasury", primarily because of the significantly smaller size of the market.
The $31 trillion U.S. bond market accounts for almost 40% of the total global bond market, compared with the $900 trillion in emerging market debt that makes up just a little over 1%.
"The bond market in developing countries is still growing and becoming more liquid," Valeri said. "It's still an under-invested asset class, but as it garners more attention and becomes a regular staple in investor portfolios, emerging market bonds could be viewed like the U.S. Treasury. But we're still years away from that."
In addition to cleaner balance sheets, emerging markets also boast prospects for stronger currencies than their developed counterparts.
"By investing in bonds denominated in local currencies of emerging markets, investors can also benefit from the appreciation of the currency on top of the income from the bond," said Brian Dennehy, financial planner and managing director of Dennehy Weller.
WisdomTree's Emerging Markets Local Debt ETF (ELD) and the Market Vectors Emerging Markets Local Currency Bond ETF (EMLC) both track the performance of debt issued in local currencies of more than a dozen developing countries including Brazil, Mexico and Russia. Over the past six months, both ETFs have gained about 5%. ![]()
| Index | Last | Change | % Change |
|---|---|---|---|
| Dow | 32,627.97 | -234.33 | -0.71% |
| Nasdaq | 13,215.24 | 99.07 | 0.76% |
| S&P 500 | 3,913.10 | -2.36 | -0.06% |
| Treasuries | 1.73 | 0.00 | 0.12% |
| Company | Price | Change | % Change |
|---|---|---|---|
| Ford Motor Co | 8.29 | 0.05 | 0.61% |
| Advanced Micro Devic... | 54.59 | 0.70 | 1.30% |
| Cisco Systems Inc | 47.49 | -2.44 | -4.89% |
| General Electric Co | 13.00 | -0.16 | -1.22% |
| Kraft Heinz Co | 27.84 | -2.20 | -7.32% |
| Overnight Avg Rate | Latest | Change | Last Week |
|---|---|---|---|
| 30 yr fixed | 3.80% | 3.88% | |
| 15 yr fixed | 3.20% | 3.23% | |
| 5/1 ARM | 3.84% | 3.88% | |
| 30 yr refi | 3.82% | 3.93% | |
| 15 yr refi | 3.20% | 3.23% |
Today's featured rates: