Click chart for more bonds and rates data
NEW YORK (CNNMoney) -- Investors flocked to the safety of Treasuries Friday after the government released a dismal report about the U.S. job market, heightening worries about another recession.
The Labor Department reported that the U.S. economy added no new jobs in August. That's the worst payroll report since September 2010 when roughly 27,000 jobs were lost.
The report sparked a sharp sell-off in stocks, and a subsequent rush to Treasuries -- perceived as a "safer" place to park cash in times of uncertainty. While the report was expected to show a slowdown in jobs, the headline number was much starker than economists had expected.
"The moves today are indicative of a little more risk of a recession, but over the last two months, things have moved more dramatically," says Guy LeBas, chief fixed income strategist at Janney & Co. "It's as if every day, the markets are predicting a greater chance of recession."
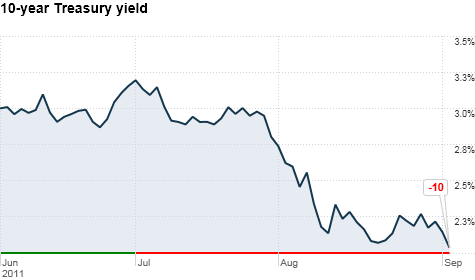
The yield on the 10-year Treasury note dropped as low as 1.991% from 2.15% late Thursday. The 10-year yield hit a record low of 1.974% on Aug. 18.
In fact, since 1962, the 10-year yield has only been below 2.4% during the financial crisis, in December 2009 and January 2010.
Prices on 30-year bonds accelerated faster than 10-year notes on Friday, causing a flattening of the yield curve -- often a key predictor of the future health of the economy.
The yield curve shows the relationship between bonds maturing at different times. It typically curves up steeply in a healthy economic environment. Any flattening of that curve has historically been seen as a sign of a slowing economy.
"The mindset is that rates aren't going to move any higher any time soon as we saw more bad employment figures on top of so many other bad economic signs," says Bill Cheoplis, a managing director at Deutsche Asset Management. "Investors are trying to get as much yield as they can now."
Still, Cheoplis warns that today's trading could be skewed since many desks are understaffed ahead of the Labor Day weekend. "This could just be a one-day trade," he said. But he also said investors should keep an eye on the differential between 10-year and 30-year Treasuries over the next several weeks.
Meanwhile traders also say that a possible move by the Federal Reserve dubbed "Operation Twist" could be another reason investors were rushing into longer-term Treasuries Friday.
Under Operation Twist, the Fed could use some of the proceeds of its portfolio to purchase longer-term Treasury notes possibly as far out as 30 years. That would allow Bernanke and Co. to help bring down long-term interest rates without printing more cash.
Bringing down those rates, so the theory goes, makes it cheaper for Americans to buy houses and corporations to invest in machinery, stimulating the economy.
"The markets think this could happen because it's an easy form of stimulus," says LeBas. "It doesn't trigger the same money printing attacks that the Fed has been vulnerable to, and it doesn't create more dollars."
Do you own a 30-year Treasury bond with an interest rate yielding over 14% (or even 15%!) that is maturing soon? How much is it worth? What are you planning to do with the money? Contact jordan.malter@turner.com with your story. ![]()
| Index | Last | Change | % Change |
|---|---|---|---|
| Dow | 32,627.97 | -234.33 | -0.71% |
| Nasdaq | 13,215.24 | 99.07 | 0.76% |
| S&P 500 | 3,913.10 | -2.36 | -0.06% |
| Treasuries | 1.73 | 0.00 | 0.12% |
| Company | Price | Change | % Change |
|---|---|---|---|
| Ford Motor Co | 8.29 | 0.05 | 0.61% |
| Advanced Micro Devic... | 54.59 | 0.70 | 1.30% |
| Cisco Systems Inc | 47.49 | -2.44 | -4.89% |
| General Electric Co | 13.00 | -0.16 | -1.22% |
| Kraft Heinz Co | 27.84 | -2.20 | -7.32% |
| Overnight Avg Rate | Latest | Change | Last Week |
|---|---|---|---|
| 30 yr fixed | 3.80% | 3.88% | |
| 15 yr fixed | 3.20% | 3.23% | |
| 5/1 ARM | 3.84% | 3.88% | |
| 30 yr refi | 3.82% | 3.93% | |
| 15 yr refi | 3.20% | 3.23% |
Today's featured rates:


