Click chart for more commodities prices
NEW YORK (CNNMoney) -- Commodity prices sold off with the rest of the broader market Monday, with investors rushing to the safe haven of cash as debt woes increased in the U.S. and Europe.
"Europe is off 3% and the U.S. is off 2%, some markets in Asia were off more than 2%, so you're seeing a rush to cash," said Carlos Sanchez, a precious metals analyst with CPM Group.
While the move to cash may seem like a panicked reaction to the debt crisis, investors say it was more likely volatility prompted by thin trading during the holiday-shortened week.
But the combination of eurozone debt worries and the looming likelihood of failure from the U.S. Congressional super committee cannot be completely ruled out, say others.
Oil prices fell 75 cents, or 0.8%, to $96.92 per barrel. PFG Best senior market analyst Phil Flynn said some traders are having a knee-jerk reaction to the ongoing worries about Europe's deepening crisis. "They remember 2008 when the economy started to freeze up," he said. "There's a concern that if Europe falls apart that's going to be deflationary, at least initially."
The dollar strengthened against the euro, rising 0.4%. Meanwhile, European stocks sold off sharply following a dire warning from Moody's on French bonds, spooking investors. The selling spilled over to U.S. markets, with all three major indexes ending around 2% lower.
"The initial flight to quality was to the dollar, to U.S. based securities, then to other assets," said Flynn.
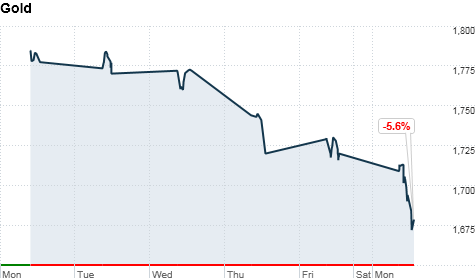
Precious metals logged slightly steeper declines. Gold prices declined $46.50, or 2.7%, to $1,678.60 per ounce and silver prices were down $1.30, or 4%, to $31.12 per ounce.
But Flynn and Sanchez say they aren't worried about the short term reaction to the debt woes. Both said prices could bounce back before the week is up.
"It's not surprising to me that [gold] would be all over the place between $1,600 and $1,900. You're probably going to see this range over the next 6 months especially the way the markets have been shaping up," Sanchez said. ![]()
| Index | Last | Change | % Change |
|---|---|---|---|
| Dow | 32,627.97 | -234.33 | -0.71% |
| Nasdaq | 13,215.24 | 99.07 | 0.76% |
| S&P 500 | 3,913.10 | -2.36 | -0.06% |
| Treasuries | 1.73 | 0.00 | 0.12% |
| Company | Price | Change | % Change |
|---|---|---|---|
| Ford Motor Co | 8.29 | 0.05 | 0.61% |
| Advanced Micro Devic... | 54.59 | 0.70 | 1.30% |
| Cisco Systems Inc | 47.49 | -2.44 | -4.89% |
| General Electric Co | 13.00 | -0.16 | -1.22% |
| Kraft Heinz Co | 27.84 | -2.20 | -7.32% |
| Overnight Avg Rate | Latest | Change | Last Week |
|---|---|---|---|
| 30 yr fixed | 3.80% | 3.88% | |
| 15 yr fixed | 3.20% | 3.23% | |
| 5/1 ARM | 3.84% | 3.88% | |
| 30 yr refi | 3.82% | 3.93% | |
| 15 yr refi | 3.20% | 3.23% |
Today's featured rates:


