Search News

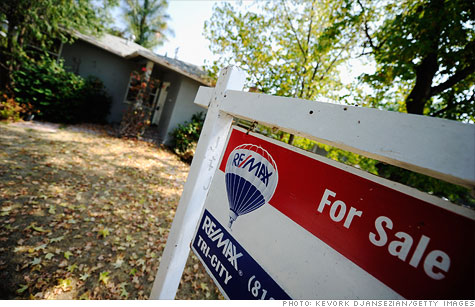
High numbers of foreclosures continue to plague housing markets.
NEW YORK (CNNMoney) -- Home prices continued to sink in the third quarter, falling to levels not seen since early 2003.
Home prices dropped 3.9% year-over-year during the three months ended Sept. 30, according to the S&P/Case-Shiller national home price index. On a quarterly basis, prices were slightly higher, squeezing out a 0.1% gain.
One bright spot was that the declines have started to slow. During the second quarter, prices were down 5.8% year-over-year.
"Any chance for a sustained recovery will probably need a stronger economy," said David Blitzer, a spokesman for S&P.
S&P/Case-Shiller's 20-City Composite Index, which tracks home prices in 20 major metropolitan areas, fell 3.6% year-over-year during September. The decline was much steeper than a consensus estimate from Briefing.com, which projected a 3% decline.
Eighteen of the 20 metropolitan areas that the index tracks saw annual declines in home prices during the month. Meanwhile, Atlanta, Las Vegas and Phoenix posted record index lows.
In Phoenix, home prices are almost back to their January 2000 levels, while in Atlanta and Las Vegas, prices have fallen even further below these levels.
Only Detroit and Washington D.C. bucked the trend, with year-over-year increases of 3.7% and 1%, respectively. D.C. also posted a month-over-month gain in home prices. Only two other cities, New York and Portland, saw home-price gains between August and September, S&P said.
The outlook: Even though other housing market metrics have improved lately, a backlog of foreclosures is expected to continue to weigh on home prices.
"We're not through the foreclosure crisis. There are a lot of foreclosures yet to happen and a large shadow supply of foreclosed homes the banks are holding," said Brad Hunter, chief economist for Metrostudy, a housing analytics company.
After many months of decline, the number of foreclosures has started climbing again. If foreclosures start flooding the market, the pressure may not be enough to send prices spiraling downward but "it could prevent prices from rising again," said Hunter.
Millions of homeowners owe more on their homes than they are worth, making them vulnerable to foreclosure.
CoreLogic (CLGX), a provider of information, analytics and business services, reported Tuesday that 10.7 million residential property owners, or 22.1% of all homeowners, were underwater at the end of the third quarter. That's only a slight improvement from the 10.9 million properties (22.5%) in the second quarter.
That much "negative equity" said Mark Fleming, chief economist with CoreLogic, "renders many borrowers vulnerable when economic shocks occur, such as job loss or illness. The nearly $700 billion mortgage debt overhang is holding back the recovery of the housing market and broader economy." ![]()
| Overnight Avg Rate | Latest | Change | Last Week |
|---|---|---|---|
| 30 yr fixed | 3.80% | 3.88% | |
| 15 yr fixed | 3.20% | 3.23% | |
| 5/1 ARM | 3.84% | 3.88% | |
| 30 yr refi | 3.82% | 3.93% | |
| 15 yr refi | 3.20% | 3.23% |
Today's featured rates: