New home sales showed improvement in the latest government report.
NEW YORK (CNNMoney) -- New home sales exceeded forecasts in the latest government readings Friday, another sign of a long-awaited recovery in the battered housing market.
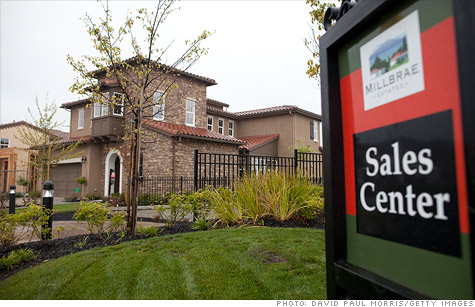
The Census Bureau reported that the pace of new home sales hit a seasonally-adjusted annual rate of 321,000 in January, up from the previous reading for December and better than economists' forecasts. Census also revised the December figure higher to a rate of 324,000, meaning that the pace of sales was about 6% stronger that month than the original estimate.
The supply of new homes for sale once again fell, the 11th straight month the inventory of new homes on the market has been at a record low level. The continued decline in supply comes even as other government readings have shown an increase in housing starts by home builders in recent months.
The tight supply, which was at 151,000 new homes in January, helped to lift prices, as the median price of a new home sold in the month rose slightly to $217,100, up $600 from December.
There are other signs that the long-suffering housing market is finally improving. The pace of sales of existing homes in January was at the highest point since the end of an $8,000 home buyers' tax credit in 2010. Mortgage rates have been at record lows until a slight increase this week.
Those low financing costs, coupled with years of price declines and some improvement in the job market have made home ownership more affordable than it has been in decades.
But home prices are still depressed, hurt by the large inventory of foreclosed homes still on the market. The price of existing homes sold in January fell to a 10-year low.. And even with the slight increase in new home prices in January, prices are still lower than the annual average for 2010 or 2011. ![]()
| Overnight Avg Rate | Latest | Change | Last Week |
|---|---|---|---|
| 30 yr fixed | 3.80% | 3.88% | |
| 15 yr fixed | 3.20% | 3.23% | |
| 5/1 ARM | 3.84% | 3.88% | |
| 30 yr refi | 3.82% | 3.93% | |
| 15 yr refi | 3.20% | 3.23% |
Today's featured rates:


