In February, China's economy imported $31.5 billion more goods and services than it exported.
NEW YORK (CNNMoney) -- China shocked the world this weekend when it announced its largest trade deficit in more than two decades.
The country has long been an export powerhouse, selling far more goods to foreigners than it buys in the world marketplace. But in February, the world's second largest economy imported $31.5 billion more goods and services than it exported, China's General Administration of Customs reported Saturday.
According to official news agency Xinhua, February's data marked the country's largest monthly trade deficit in 22 years.
Why the dramatic change?
At first, a steep drop in exports heightened fears that China's economy is slowing down, partly due to weaker demand from Europe, its largest trading partner.
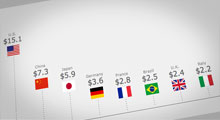
As the eurozone teeters on the brink of a recession, China's exports to the region have slumped. In February, they fell $9 billion, or one third, compared to January.
Meanwhile, a slow U.S. recovery has also dragged on China's trade. Chinese exports to the United States dropped $7.3 billion last month.
Economists had predicted a trade deficit but weren't anticipating one nearly that deep. The news sent Chinese stocks falling and the yuan sinking against the dollar.
But some observers thought February could be a statistical anomaly, and that the deficit should not be taken as a worrisome sign.
While the Chinese government adjusts the figures for seasonal distortions, the Chinese New Year usually has a dampening effect on the data.
During the 15-day holiday, which started on Jan. 23, Chinese manufacturers cut back on production, if not shut down altogether to celebrate the holiday, which slows exports dramatically.
"The seasonal adjustment of these figures is just awful," Carl Weinberg, chief economist with High Frequency Economics said in a note. "Exports and imports always drop in February, with exports always falling more than imports."
Even the People's Bank of China Governor Zhou Xiaochuan warned not to take the numbers too seriously. He urged markets to look at the trade balance over the long term instead.
To make up for the volatility in the data, some economists like to average the figures for both January and February. Doing so reveals that both exports and imports are still growing far slower than they were in 2011.
That could mean China's government will be more likely to launch stimulative measures to support its economy, Qu Hongbin, Asia economist for HSBC said in a note.
Just a year ago, China's government was focused on curbing rapidly rising consumer prices. Now that inflation has slowed, it's turning its focus to economic growth.
"The trade data confirms the weakness in both China's external and domestic fronts," Qu said. "This reinforces the need for further easing measures, especially with inflation falling faster than expected." ![]()
| Overnight Avg Rate | Latest | Change | Last Week |
|---|---|---|---|
| 30 yr fixed | 3.80% | 3.88% | |
| 15 yr fixed | 3.20% | 3.23% | |
| 5/1 ARM | 3.84% | 3.88% | |
| 30 yr refi | 3.82% | 3.93% | |
| 15 yr refi | 3.20% | 3.23% |
Today's featured rates:
| Latest Report | Next Update |
|---|---|
| Home prices | Aug 28 |
| Consumer confidence | Aug 28 |
| GDP | Aug 29 |
| Manufacturing (ISM) | Sept 4 |
| Jobs | Sept 7 |
| Inflation (CPI) | Sept 14 |
| Retail sales | Sept 14 |