Ridership on mass transit reaches second highest level since 1957 as gas prices soar.
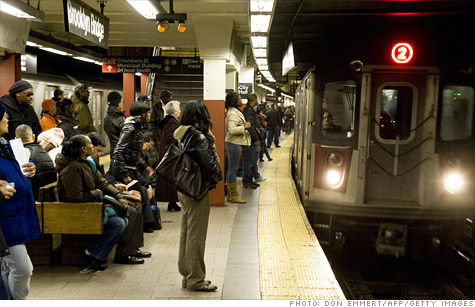
NEW YORK (CNNMoney) -- Ridership on the nation's trains and buses hit one of the highest levels in decades, with officials crediting high gas prices, a stronger economy and new technology that makes riding public transit easier.
In 2011, Americans took 10.4 billion trips on mass transit -- which includes buses, trains, street cars and ferries, according to the American Public Transportation Association.
That's a 2.3% increase over 2010 and just shy of the number of trips in 2008, when gasoline spiked to a record national average of $4.11 a gallon.
"As people get jobs and go back to work, they get on mass transit more," said Michael Melaniphy, president of APTA. "And then when people look at gas prices, they really get on transit more."
Melaniphy said gas prices near $4 a gallon tends to be the tipping point that pushes more people onto mass transit.
While the highest gasoline price spike was in 2008, gas prices averaged $3.51 a gallon in 2011 -- the highest annual average ever.
Currently, nationwide average gas prices are just above $3.80 -- the highest ever for this time of year, according to AAA.
Many analysts expect record gas prices in 2012 as the global economy recovers and tensions remain high in the Middle East.
Ridership on public transit, which is measured by number of trips taken, hit its highest level in the mid-1940s -- roughly double today's rate.
But with the widespread adoption of the automobile and America's suburbanization in the 1950s, public transit use steadily declined until the early 1970s, when gas prices spiked following the Arab oil embargo. 2011's ridership rate is the second highest since 1957.
In addition to gas prices and a rebounding economy, Melaniphy said new technologies have made taking public transportation easier for the general public.
A plethora of mobile-phone applications -- there are over 100 for New York City alone -- can display train or bus schedules for your current location. And count-down clocks at train platforms or bus stops take some of the frustration out of waiting for your ride.
"Our member agencies are putting a better product out on the street," said Melaniphy.
Roughly 5% of the population commutes using public transport, according to the Census Department.
Spending on public transport totals roughly $50 billion a year, Melaniphy said. He noted that 75% of those dollars find their way to private companies in the form of construction contracts, fuel purchases and other expenditures.
Funding for public transportation is split roughly evenly between federal dollars from the gasoline tax, money from state and local property and sales taxes, and ridership fees. ![]()
| Overnight Avg Rate | Latest | Change | Last Week |
|---|---|---|---|
| 30 yr fixed | 3.80% | 3.88% | |
| 15 yr fixed | 3.20% | 3.23% | |
| 5/1 ARM | 3.84% | 3.88% | |
| 30 yr refi | 3.82% | 3.93% | |
| 15 yr refi | 3.20% | 3.23% |
Today's featured rates:
| Latest Report | Next Update |
|---|---|
| Home prices | Aug 28 |
| Consumer confidence | Aug 28 |
| GDP | Aug 29 |
| Manufacturing (ISM) | Sept 4 |
| Jobs | Sept 7 |
| Inflation (CPI) | Sept 14 |
| Retail sales | Sept 14 |


