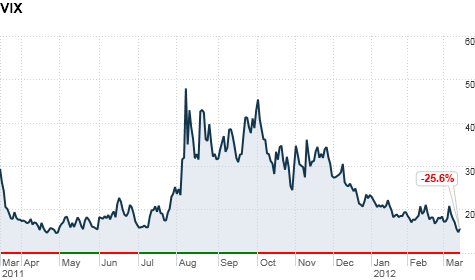
The market's fear gauge, the VIX, is hovering around a 5-year low. Click chart for more data.
NEW YORK (CNNMoney) -- One look a the market's fear gauge and it sure looks like investors are decidedly less fearful. But look a little deeper and there are signs that volatility could be right around the corner.
The VIX, the Chicago Board Options Exchange's index of market volatility, hit its lowest level since 2007 this week, following news that most major banks, except Citigroup (C, Fortune 500), Ally Financial, SunTrust (STI, Fortune 500) and financial firm Metlife (MET, Fortune 500), had passed the U.S. government's so-called stress tests.
A series positive economic reports were already boosting optimism about the health of the U.S. economy.
The VIX bounced off its five-year lows early Thursday but is still down nearly 70% from recent highs hit in August 2011. And at 15.31, it has a ways to go before it hits the fear tipping point of 30.
For now, it's suggesting trading will remain in a narrow range for at least the next month.
Remember the wild gyrations of the Dow Jones Industrial Average (INDU) in the second half of 2011, when a several hundred point drop became de rigueur?
The VIX rose to nearly 50 in August 2011, after Standard & Poors' downgraded the credit rating of the United States. Even as the VIX soared in late 2011, it stayed well below its peak level of almost 90 hit in October 2008 -- after Lehman Brothers collapsed.
This year has been a different story.
Stocks have moved steadily higher in 2012, with fewer big swings. The S&P 500 (SPX) is up 11% from the start of the year; the Dow is up 8%; and the Nasdaq (COMP) is up nearly 17%.
But experts warn that investors shouldn't get too complacent. In fact, VIX futures are predicting that the market will become more volatile as soon as next month. The April VIX is hovering around 22.
"[The current VIX] is an optical illusion," said Janet Tavakoli, president of Tavakoli Structured Finance. "The smart money is saying something different about the market."
The smart money, according to Tavakoli, is betting on only a brief respite from volatility.
"Investors are expecting the VIX to rise significantly in the next month," said Jamie Tyrell, a derivatives trader at Group One in Chicago. "There's a bet that over the next month we'll move into an environment where the market is moving more on a daily basis."
Still, at least one analyst believes that even if volatility spikes, there's virtually no chance of a return to the levels of the 2008 financial crisis.
"The VIX is somewhat of a concurrent indicator. It doesn't tell us where the market is going to go, but it's definitely not 2008 and it's not going to be," said Jack Malvey, chief global market strategist for BNY Mellon Asset Management. "Folks are willing to take risks and that spills over into reduced volatility." ![]()
| Index | Last | Change | % Change |
|---|---|---|---|
| Dow | 32,627.97 | -234.33 | -0.71% |
| Nasdaq | 13,215.24 | 99.07 | 0.76% |
| S&P 500 | 3,913.10 | -2.36 | -0.06% |
| Treasuries | 1.73 | 0.00 | 0.12% |
| Company | Price | Change | % Change |
|---|---|---|---|
| Ford Motor Co | 8.29 | 0.05 | 0.61% |
| Advanced Micro Devic... | 54.59 | 0.70 | 1.30% |
| Cisco Systems Inc | 47.49 | -2.44 | -4.89% |
| General Electric Co | 13.00 | -0.16 | -1.22% |
| Kraft Heinz Co | 27.84 | -2.20 | -7.32% |
| Overnight Avg Rate | Latest | Change | Last Week |
|---|---|---|---|
| 30 yr fixed | 3.80% | 3.88% | |
| 15 yr fixed | 3.20% | 3.23% | |
| 5/1 ARM | 3.84% | 3.88% | |
| 30 yr refi | 3.82% | 3.93% | |
| 15 yr refi | 3.20% | 3.23% |
Today's featured rates:


