The stock market is hitting new records almost daily (it happened again on Friday), but the reality isn't as rosy as it seems.
When people talk about how the "stock market" is doing, they often look at the S&P 500 index. It's currently at 1,923, the highest level it has ever been.
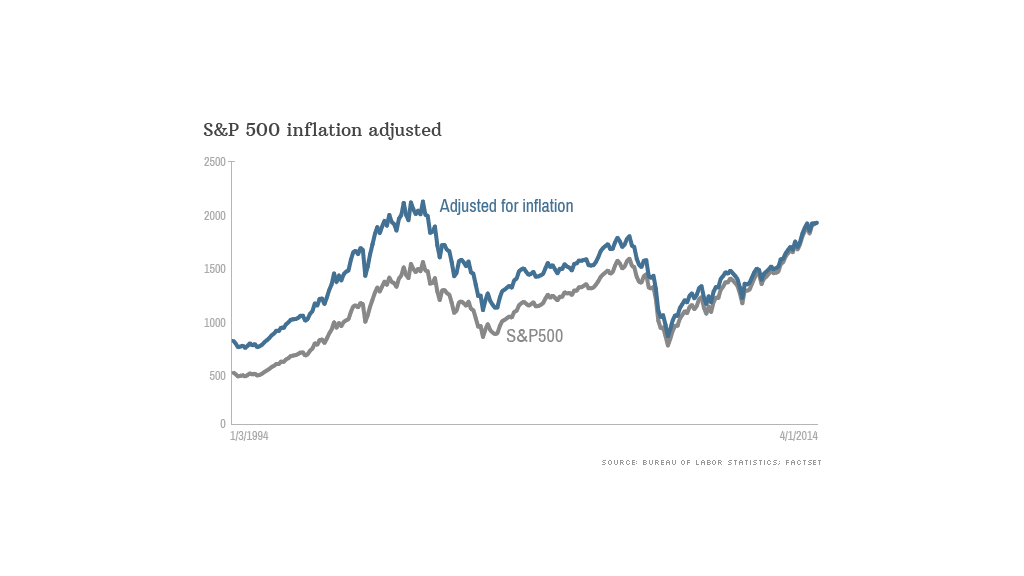
There's just one problem: That record level is in "nominal" terms. It doesn't account for inflation.
Consider that $1 doesn't buy as much as it used to -- in the stock market or even at a fast food restaurant. Thanks to inflation, you have to make more money today to be able to buy as much as you did a few years ago.
Will Hausman, an economics professor at the College of William and Mary, calculates that the S&P 500 hit its true high -- its inflation-adjusted high -- of 2,120 on January 14, 1999.
To put that another way, the market still needs to rise about 200 more points -- over 10% -- to be on par with where it was in the late 1990s. Perhaps Prince was onto something when he told us all to "Party like it's 1999."
If you don't account for inflation, you suffer from what Hausman dubs a "money illusion."
You think you're richer than you actually are. When you go out to spend your earnings from the stock market, you quickly realize that inflation has eaten up some of your gains.
Related: Get ready for lousy stock returns
Dividends make the story even more complicated.
Many of the companies in the S&P 500 send investors a check each month called a dividend. This stream of income remains relatively steady whether the company's stock price goes up or down.
When dividends are included, the so-called "total return" of the S&P 500 has already surpassed its inflation adjusted high. It first crossed that line in May 2013, according to Ed Clissold, U.S. market strategist for Ned Davis Research Group.
Related: Stop selling! Stocks are still your best investment
There's yet another wrinkle.
The Dow Jones industrial average, another closely watched measure of the U.S. stock market, has already surpassed its inflation-adjusted high.
The Dow's prior peak occurred in 2000, but it passed that level last year.
So why the discrepancy between the Dow and the S&P 500?
It comes down to how the two indexes are composed.
The Dow is calculated using the average stock price of a group of 30 big companies. By contrast, the S&P 500 is based on the market capitalization of (as the name suggests) 500 large companies.
Related: How high can Apple stock go?
Then there is the Nasdaq. Considered a proxy for the technology industry, the Nasdaq has yet to reach its nominal all-time high, let alone its inflation-adjusted high, from 2000. At that time, there was a massive bubble in Internet stocks.
So what does all this mean for the future of the stock market?
Clissold says the fact that the S&P 500 remains significantly below its inflation-adjusted high is "part of a growing body of evidence that we're in a secular bull market."
In other words, stocks could go up more, but investors shouldn't get complacent. The fact that stocks are at all-time nominal highs suggests the market is vulnerable to a pullback.
Clissold say the S&P 500 could experience a correction, usually defined as a drop of 10% or more, in the short run. Still, he added, "corrections in a secular bull market tend to be short and shallow."
-- CNNMoney's Annalyn Kurtz contributed to this report.

