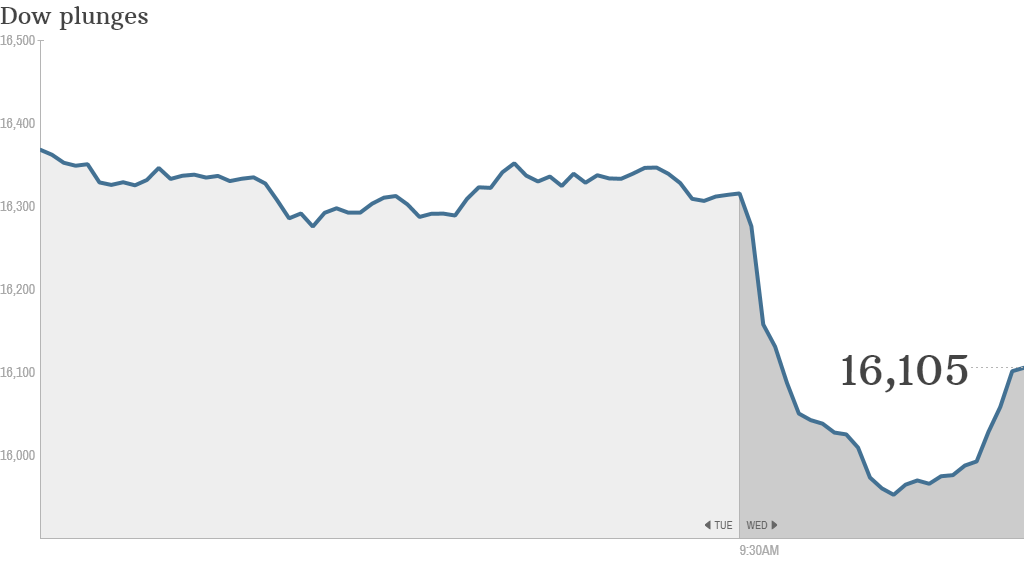
It's another "look out below" day in the stock market.
The Dow plunged as much as 460 points Wednesday afternoon before pulling back a bit, although a 173 point loss isn't anything to cheer. There wasn't an obvious trigger. Ebola and Europe's sour economy are clearly worrying. Earnings have been so-so, and retail sales data out this morning was disappointing.
October has been a brutal month, erasing most of the 2014 stock market gains. The Dow is negative for the year, and CNNMoney's Fear & Greed Index is showing extreme fear.
Most investors are better off not obsessing about the day to day market moves.
But if you're keeping an eye on the numbers, here are three critical stats to watch. There is no "magic number" that triggers a sell-off, but these indicators would be big red flags.
1. We're near a correction, but not there yet
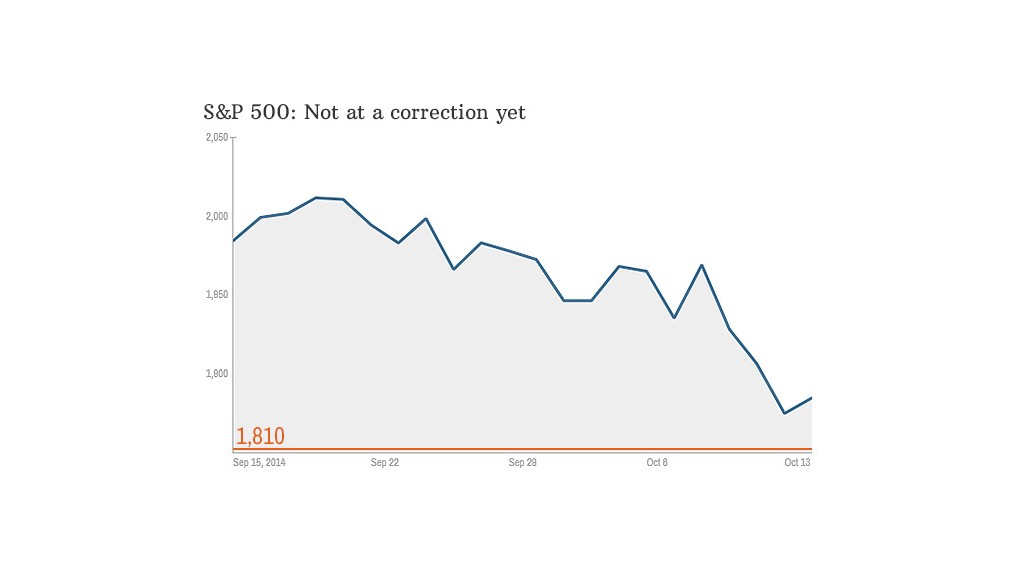
Only a month ago, the S&P 500 index closed at an all-time high of 2,011. At its worst point on Wednesday, the index was down around 9.5% since that September high. That's rough, but it's not quite the 10% drop that would constitute a true correction, let alone the 20% drop that would signal a bear market.
Related: Stocks should fall more. Corrections are normal
Keep an eye on this number: 1,810. If the S&P 500 slips below that, we're in a correction. As of Wednesday afternoon, the S&P is hovering around 1,860.
(For those who like numbers, at the nadir of the financial crisis in March 2009, the S&P 500 closed below 700).
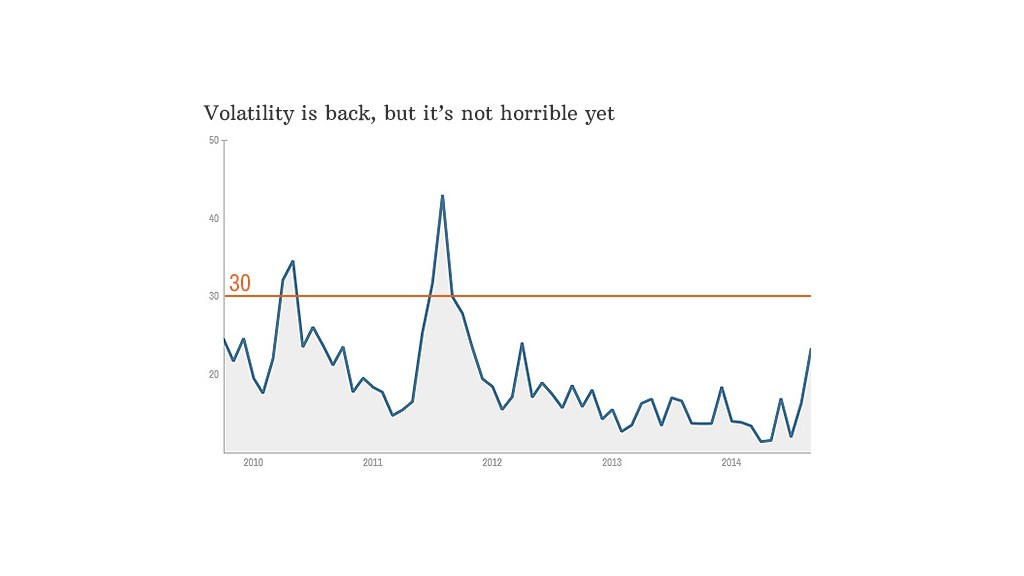
2. Volatility is back: It's getting windy, but not quite gale force wind levels
Most days the stock market moves a little bit higher or lower. For instance, the S&P 500 moved less than 0.2% on Tuesday. But since the end of October, the stock market has had numerous "wild swings" where it shifts more than 1% (or even more than 2% in some cases).
Related: Is it time to exit stocks?
That's referred to as volatility. The VIX Index is the main measure of volatility. It has spiked about 80% in the past month -- a huge jump. The VIX was all over the place on Wednesday, but settled around 26. That's a lot higher than the 12 to 13 it was at a month ago.
But the unofficial alarm bell is when the VIX hits the 30 mark. It crossed that line briefly Wednesday before falling back.
3. Investors are putting money into bonds. It's debatable whether it's a 'freak out'
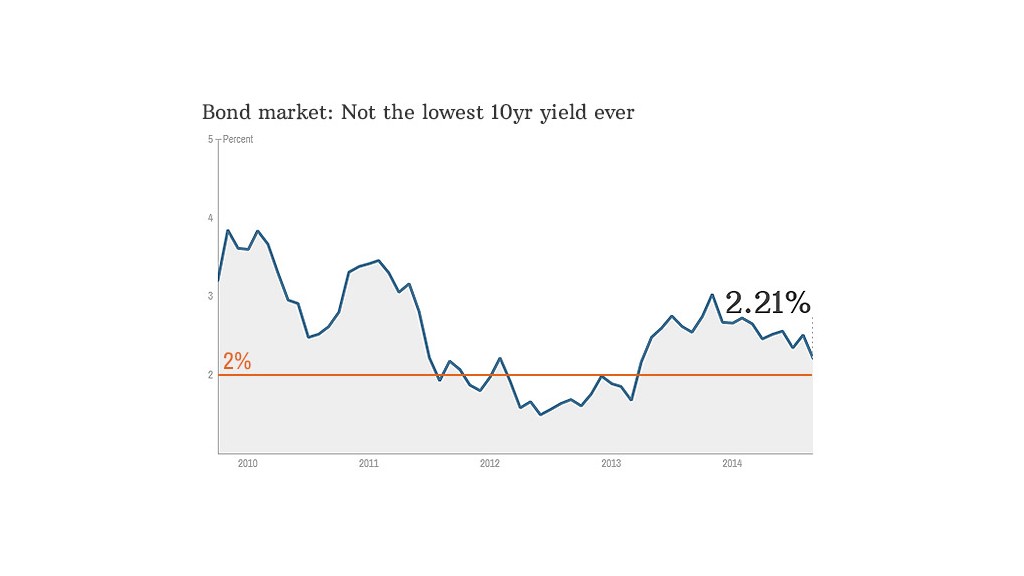
When investors get scared, they don't run to mom, they run to bonds, especially U.S. government bonds. The yield on the 10-year Treasury is a good indicator of just how many people are seeking the safe arms of the bond market.
When the yield falls, you know people are gobbling up bonds.
In the middle of September, the yield on the 10-year Treasury was around 2.6%. On Tuesday it was at 2.2%. That's a quick drop, but the real indicator of a meltdown would be for the yield to drop to 2% or even below.
Sure enough, on Wednesday, the yield fell below that mark several times, although it ended the day above 2.1%.
Dropping below that "magic two" number isn't unheard of. It happened in early 2013 and in 2012 when Europe was in the midst of a debt crisis and America's economic recovery was looking uncertain.
Market jitters are clearly back, but we're not quite in a "correction" yet.
Editor's note: This story was updated Wednesday at 3:45pm ET.

