Is the sky falling for stocks?
Time to head for the hills and put all your money into cash and gold?
No.
But some investors are starting to worry the market could be due for another huge sell-off -- just like the infamous Black Monday crash that happened exactly 29 years ago.
October 19, 1987.
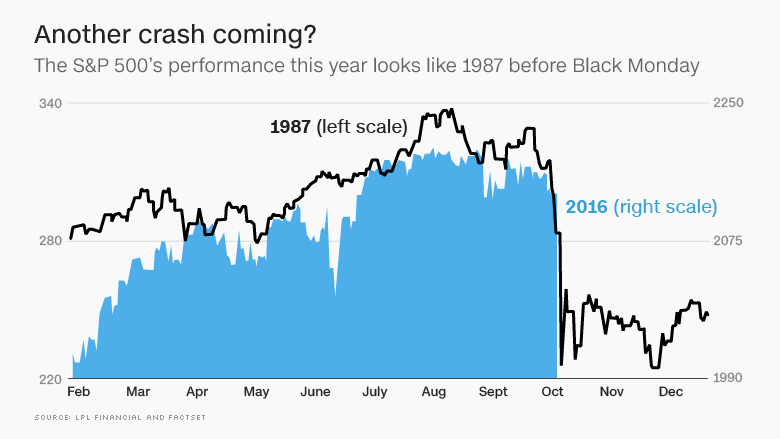
In anticipation of this not particularly significant milestone, some traders have started to circulate a stock chart that appears to show eerie parallels to 1987.
I've gotten several emails about it and have seen it often on Twitter this month.
If you look at it quickly, it's more frightening than any creepy clowns that may be wandering around your neighborhood this Halloween.
But look again.
And calm down.
The chart simply traces the current performance of the S&P 500 over the 1987 chart. It doesn't take into account percentage moves.
That's why Ryan Detrick, a senior market strategist with LPL Financial, is warning investors to not succumb to fear and assume that another mega-crash is coming.
Gigantic drops in the market usually happen either for a specific reason -- think the collapse of Lehman in 2008 -- or because investors were too complacent. Investors are definitely NOT complacent now.
If anything, many average investors now seem conditioned to think that another big drop is around the corner. There's a sense of distrust.
"Look at overall market sentiment and there are a lot of worries and concern about the election and earnings," Detrick said. "So when you see a chart like the 1987 one, it gets people more riled up."
But Detrick points out that in the beginning of 1987, stocks were on fire. The S&P 500 soared more than 30% by August and then quickly cooled off. It had already pulled back by more than 15% from its peak before Black Monday.
Related: Big banks thrive despite Wells Fargo, Deutsche Bank and Brexit
That hasn't happened this year. Stocks tumbled in January and February before rebounding. The market briefly dipped after the Brexit vote in late June, but has since bounced back. Stocks are up this year, but only modestly. Bulls aren't running wild.
"The market is not nearly as overbought now as it was in 1987 before the crash," Detrick said.
Brad McMillan, chief investment officer for Commonwealth Financial Network, agrees that the time to be nervous is when people aren't actually afraid. Complacency tends to lead to big drops.
"When I see calls for a 1987-type event, I draw two conclusions. First, markets are still worrying, which is actually a good sign. Second, because of that worry, a long-term pullback is much less likely," McMillan wrote in a recent report.
CNNMoney's Fear and Greed Index, which measures seven indicators of market sentiment, isn't showing signs of a bubble about to burst either. The index is currently flashing signs of Fear.
That could also bode well for stocks.
Want more business news? Download the CNN MoneyStream app
"Bull markets don't end due to caution. They end on euphoria. It's healthy to have skepticism," said Scott Colyer, CEO of Advisors Asset Management. "You rarely have violent sell-offs when everybody is warning about it."
It's also worth noting that a similarly spooky chart made the rounds back in 2014. That appeared to show how stocks were starting to look suspiciously like the market did in 1929. That chart also ignored percentage moves in favor of a quick and dirty trace job.
Last I checked, the market hasn't completely collapsed in the past two years and we aren't in the middle of a second Great Depression. So don't get too concerned by those scary charts you might see on Twitter.

