5 ways to know if the bull is over

Before it keels over, a bull market typically leaves a few road signs. Here's what to keep an eye on - from Money Magazine.

Corporate earnings growth
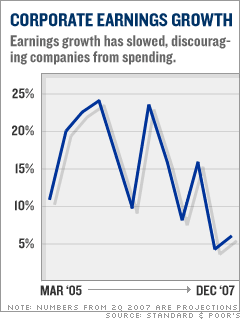
Before a bear: Corporate earnings growth often slows
Happened yet? Just wait for the '07 numbers

During the bull market of the mid- to late '90s, average earnings for the S&P 500 rose more than 12% a year. When companies began warning of slowing profit growth in 2000, stocks started to nosedive.

Now for the current bull. From 2003 to 2006, the S&P's annual earnings rose more than 17%, on average. But the consensus estimate of the market strategists tracked by Thomson Financial is that earnings will grow by only 7% in 2007 - a huge change.

It's not hard to see why. Productivity growth is down. Wage pressures are rising. And remember those soaring energy prices we just talked about? On top of all that, long-term rates in the first half of the year were sneaking up. If that trend resumes, it will discourage companies from borrowing in order to make big investments.

"If liquidity should dry up," says John Fox, co-manager of the FAM Value fund, "that would be a negative."

Translation: It could make this bull look like hamburger.

Outlook Oil prices Treasury yields Number of rising stocks Consumer spending Corporate earnings growth
Report: Big-money investors at one-year high for risk aversion. (more)
Is the worst over? Here's a 10-point guide to understanding two harrowing weeks - and what's likely to happen next. (more)
But strength of markets, economy should prevent a recession, Treasury Secretary says in a news report. (more)

Most stock quote data provided by BATS. Market indices are shown in real time, except for the DJIA, which is delayed by two minutes. All times are ET. Disclaimer. Morningstar: © 2018 Morningstar, Inc. All Rights Reserved. Factset: FactSet Research Systems Inc. 2018. All rights reserved. Chicago Mercantile Association: Certain market data is the property of Chicago Mercantile Exchange Inc. and its licensors. All rights reserved. Dow Jones: The Dow Jones branded indices are proprietary to and are calculated, distributed and marketed by DJI Opco, a subsidiary of S&P Dow Jones Indices LLC and have been licensed for use to S&P Opco, LLC and CNN. Standard & Poor's and S&P are registered trademarks of Standard & Poor's Financial Services LLC and Dow Jones is a registered trademark of Dow Jones Trademark Holdings LLC. All content of the Dow Jones branded indices © S&P Dow Jones Indices LLC 2018 and/or its affiliates.

Most stock quote data provided by BATS. Market indices are shown in real time, except for the DJIA, which is delayed by two minutes. All times are ET. Disclaimer. Morningstar: © 2018 Morningstar, Inc. All Rights Reserved. Factset: FactSet Research Systems Inc. 2018. All rights reserved. Chicago Mercantile Association: Certain market data is the property of Chicago Mercantile Exchange Inc. and its licensors. All rights reserved. Dow Jones: The Dow Jones branded indices are proprietary to and are calculated, distributed and marketed by DJI Opco, a subsidiary of S&P Dow Jones Indices LLC and have been licensed for use to S&P Opco, LLC and CNN. Standard & Poor's and S&P are registered trademarks of Standard & Poor's Financial Services LLC and Dow Jones is a registered trademark of Dow Jones Trademark Holdings LLC. All content of the Dow Jones branded indices © S&P Dow Jones Indices LLC 2018 and/or its affiliates.