6 of 10
BACKNEXT
Least affordable: New York
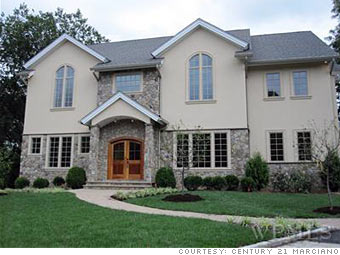
A big beautiful house in a Westchester suburb of New York City costs $1.849 million.
Median home price: $426,000
Median income: $65,600
Affordability score: 20.9%

Home prices can be staggeringly high in the New York City metro area, but median income is not commensurately high; it's under $65,000. That combo makes this the country's least affordable major metro area.

Affordability has improved lately: The median home price has fallen from about $500,000 at the market peak, and more properties are within reach now that mortgage rates are near historic lows.

After holding up better and longer than most housing markets, sales and prices around New York City have started to experience greater declines. The market is highly influenced by what's happening on Wall Street; when financial markets sneeze, the real estate industry says "God bless you" with feeling.

Financial markets have stabilized a bit lately and investment banks are paying out bonuses. That could hasten a housing market recovery in the metro area.

NEXT: Runner up: San Francisco
Email | Print | Share
 
google my aol my msn my yahoo! netvibes
Paste this link into your favorite RSS desktop reader
See all CNNMoney.com RSS FEEDS (close)
Last updated May 24 2010: 1:00 PM ET
Source: National Association of Home Builders (NAHB) and Wells Fargo
More Galleries
10 of the most luxurious airline amenity kits When it comes to in-flight pampering, the amenity kits offered by these 10 airlines are the ultimate in luxury More
7 startups that want to improve your mental health From a text therapy platform to apps that push you reminders to breathe, these self-care startups offer help on a daily basis or in times of need. More
5 radical technologies that will change how you get to work From Uber's flying cars to the Hyperloop, these are some of the neatest transportation concepts in the works today. More

Special Offer

Most stock quote data provided by BATS. Market indices are shown in real time, except for the DJIA, which is delayed by two minutes. All times are ET. Disclaimer. Morningstar: © 2018 Morningstar, Inc. All Rights Reserved. Factset: FactSet Research Systems Inc. 2018. All rights reserved. Chicago Mercantile Association: Certain market data is the property of Chicago Mercantile Exchange Inc. and its licensors. All rights reserved. Dow Jones: The Dow Jones branded indices are proprietary to and are calculated, distributed and marketed by DJI Opco, a subsidiary of S&P Dow Jones Indices LLC and have been licensed for use to S&P Opco, LLC and CNN. Standard & Poor's and S&P are registered trademarks of Standard & Poor's Financial Services LLC and Dow Jones is a registered trademark of Dow Jones Trademark Holdings LLC. All content of the Dow Jones branded indices © S&P Dow Jones Indices LLC 2018 and/or its affiliates.