2. Nevada
Nevada
State GDP: $112 billion
Growth in 2010: -0.2%

The national economy slowly started to improve last year, but Nevada's losing streak continued well into 2010.

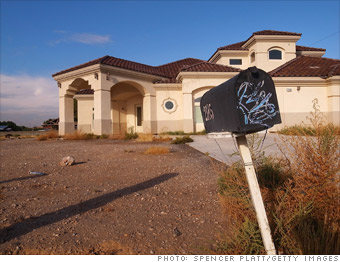
The housing market's boom and bust was most extreme in Nevada. By the end of 2010, one in every 99 houses was in foreclosure.

Declines in the construction and real estate sectors were so severe, they far outweighed slight pickups in business at hotels, restaurants and mining companies.

In April, Nevada had the country's highest unemployment rate, at 12.5%.


Last updated June 17 2011: 12:05 PM ET
Join the Conversation

Check this interactive map to see how each state economy grew (or fell) last year. More

North Dakota surged due to oil, whereas Wall Street's rebound boosted New York. More

Most Popular


Most stock quote data provided by BATS. Market indices are shown in real time, except for the DJIA, which is delayed by two minutes. All times are ET. Disclaimer. Morningstar: © 2018 Morningstar, Inc. All Rights Reserved. Factset: FactSet Research Systems Inc. 2018. All rights reserved. Chicago Mercantile Association: Certain market data is the property of Chicago Mercantile Exchange Inc. and its licensors. All rights reserved. Dow Jones: The Dow Jones branded indices are proprietary to and are calculated, distributed and marketed by DJI Opco, a subsidiary of S&P Dow Jones Indices LLC and have been licensed for use to S&P Opco, LLC and CNN. Standard & Poor's and S&P are registered trademarks of Standard & Poor's Financial Services LLC and Dow Jones is a registered trademark of Dow Jones Trademark Holdings LLC. All content of the Dow Jones branded indices © S&P Dow Jones Indices LLC 2018 and/or its affiliates.