The world in tweets and photos

A dazzling data visualization shows how we've re-mapped our local geography with overlays of images and words.

Photographer and self-described "geek of maps" Eric Fischer likes to explore the visual intersection of geography and user-generated data. His previous projects have illustrated racial divisions in the U.S., the urban photographic habits of locals and tourists, and traffic patterns in San Francisco.

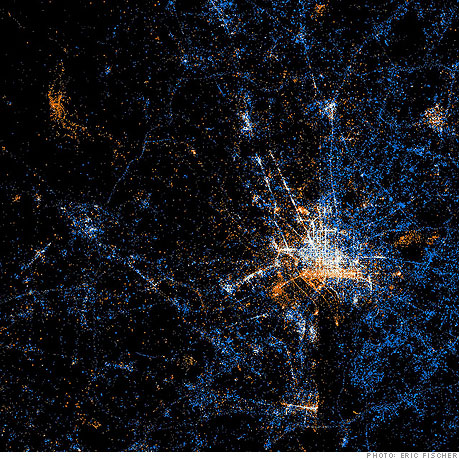
This week Fischer unveiled his latest project: A series of world maps correlating geographic locations with geotagged photos from Flickr and tweets from Twitter. Red dots pinpoint the locations of Flickr pictures, blue dots show tweets, white dots mark places that have been posted to both.

This map of Washington, D.C., shows messages concentrating around the national landmarks and power corridors of the city's federal zone.


By Stacy Cowley - Last updated July 12 2011: 11:02 AM ET
Join the Conversation
Most Popular


Most stock quote data provided by BATS. Market indices are shown in real time, except for the DJIA, which is delayed by two minutes. All times are ET. Disclaimer. Morningstar: © 2018 Morningstar, Inc. All Rights Reserved. Factset: FactSet Research Systems Inc. 2018. All rights reserved. Chicago Mercantile Association: Certain market data is the property of Chicago Mercantile Exchange Inc. and its licensors. All rights reserved. Dow Jones: The Dow Jones branded indices are proprietary to and are calculated, distributed and marketed by DJI Opco, a subsidiary of S&P Dow Jones Indices LLC and have been licensed for use to S&P Opco, LLC and CNN. Standard & Poor's and S&P are registered trademarks of Standard & Poor's Financial Services LLC and Dow Jones is a registered trademark of Dow Jones Trademark Holdings LLC. All content of the Dow Jones branded indices © S&P Dow Jones Indices LLC 2018 and/or its affiliates.