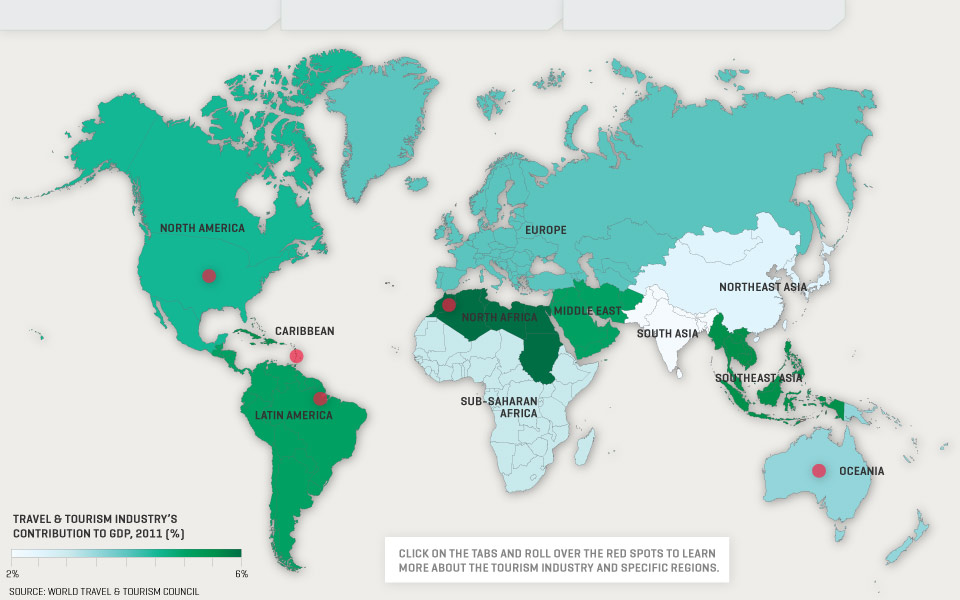
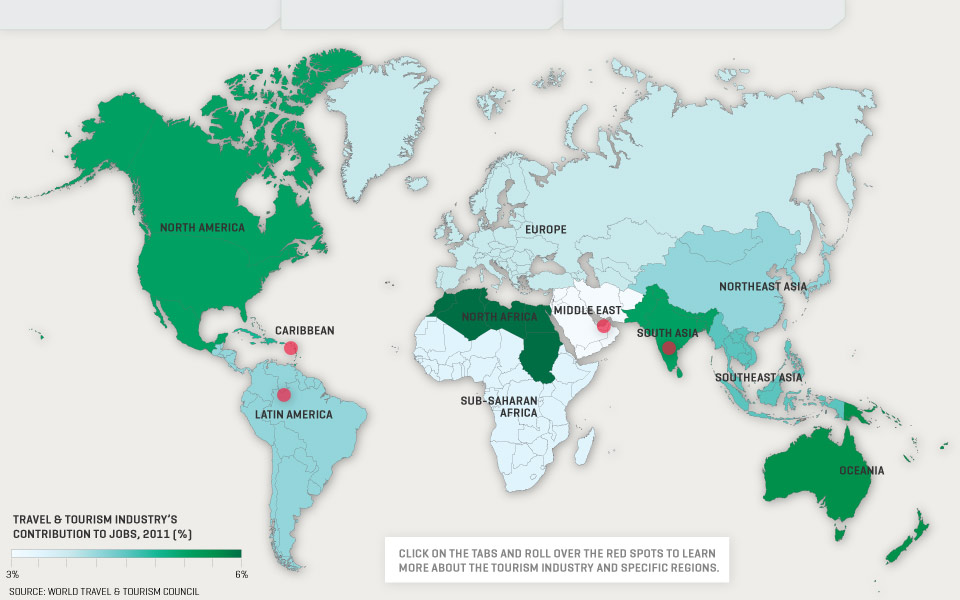
The summer holiday season is coming to a close, so it's a perfect time to take a look at the economic impact of international travel and tourism around the world. In 2011, travel and tourism generated $2 trillion globally -- 2.8% of the global GDP, which puts the industry ahead of such global forces as automotive manufacturing, according to a report released by the World Travel and Tourism Council. The report also notes that when related receipts are taken into account -- investments, visitor spending, supply chains, and the like -- the economic contribution to GDP nearly triples.
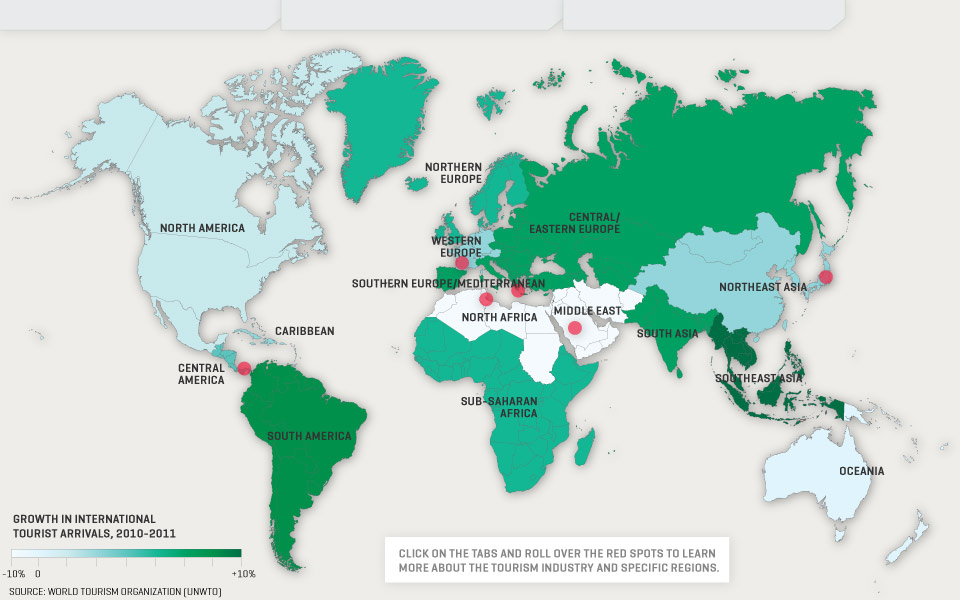
Despite setbacks in several regions, the GDP contribution of the travel and tourism industry as a whole grew by 3% over 2011. Notable changes occurred in Asia, where natural disasters in Japan and Thailand influenced inbound and outbound travel; northern Africa, where violent uprisings and political unrest posed security fears; and southern Europe and the Mediterranean, where despite economic uncertainty and austerity measures, international tourist arrivals increased by 7.7%, according to the United Nations' World Tourism Organization.
The UNWTO reports France was the most visited country in the world last year, followed by the United States, China, Spain, and Italy. With international tourism continuing to grow steadily, and the industry's contribution to GDP forecasted to show an annual growth of 4.2% over the next ten years, travel and tourism continues to be an important sector to follow -- and a relevant indicator of the world's emerging economies.