CNN values your feedback
1. How relevant is this ad to you?
2. Did you encounter any technical issues?
Video player was slow to load content
Video content never loaded
Ad froze or did not finish loading
Video content did not start after ad
Audio on ad was too loud
Other issues
Ad never loaded
Ad prevented/slowed the page from loading
Content moved around while ad loaded
Ad was repetitive to ads I've seen previously
Other issues
Cancel
Submit
Thank You!
Your effort and contribution in providing this feedback is much appreciated.
Close
Ad Feedback
Close icon
Business
Markets
Tech
Media
Calculators
Videos
More
Markets
Tech
Media
Calculators
Videos
Watch
Listen
Live TV
Sign in
My Account
Settings
Topics You Follow
Sign Out
Your CNN account
Sign in to your CNN account
Sign in
My Account
Settings
Topics You Follow
Sign Out
Your CNN account
Sign in to your CNN account
Live TV
Listen
Watch
Edition
US
International
Arabic
Español
Edition
US
International
Arabic
Español
Markets
Tech
Media
Calculators
Videos
Follow CNN Business
US
Crime + Justice
Energy + Environment
Extreme Weather
Space + Science
World
Africa
Americas
Asia
Australia
China
Europe
India
Middle East
United Kingdom
Politics
SCOTUS
Congress
Facts First
2024 Elections
Business
Tech
Media
Calculators
Video
Markets
Pre-markets
After-Hours
Market Movers
Fear & Greed
World Markets
Investing
Markets Now
Before the Bell
Nightcap
Opinion
Political Op-Eds
Social Commentary
Health
Life, But Better
Fitness
Food
Sleep
Mindfulness
Relationships
Entertainment
Movies
Television
Celebrity
Tech
Innovate
Gadget
Foreseeable Future
Mission: Ahead
Upstarts
Work Transformed
Innovative Cities
Style
Arts
Design
Fashion
Architecture
Luxury
Beauty
Video
Travel
Destinations
Food & Drink
Stay
Videos
Sports
Pro Football
College Football
Basketball
Baseball
Soccer
Olympics
Hockey
Watch
Live TV
CNN Headlines
CNN Shorts
Shows A-Z
CNN10
CNN Max
Listen
CNN Underscored
Electronics
Fashion
Beauty
Health & Fitness
Home
Reviews
Deals
Money
Gifts
Travel
Outdoors
Pets
CNN Store
Coupons
Target
Kohl’s
Wayfair
Chewy
Shein
Weather
Climate
Storm Tracker
Wildfire Tracker
Video
About CNN
Photos
Investigations
CNN Profiles
CNN Leadership
CNN Newsletters
Work for CNN
Markets
DOW
S&P 500
NASDAQ
Hot Stocks
Fear & Greed Index
-----
is driving the US market
Latest Market News
Baltimore files legal claim against owner and operator of cargo ship that rammed bridge
The electric car revolution is on track, says IEA
Columbia University main campus classes will be hybrid until semester ends; NYU students, faculty arrested during protests
Hot Stocks
Something isn't loading properly. Please check back later.
Ad Feedback
Leon Neal/Getty Images
After Tesla’s falling sales, layoffs and other problems, this is a crucial earnings report
Julia Nikhinson/Reuters
Baltimore files legal claim against owner and operator of cargo ship that rammed bridge
STR/AFP/Getty Images
The electric car revolution is on track, says IEA
Adam Gray/Reuters
Columbia University main campus classes will be hybrid until semester ends; NYU students, faculty arrested during protests
Mike Kemp/In Pictures/Getty Images
US sues to block Tapestry’s Capri deal citing handbag market domination
Republic Records/AP
Taylor Swift’s ‘Tortured Poets Department’ shatters streaming records across Spotify, Amazon, Apple
Xiaolu Chu/Getty Images
Tesla cuts prices in US, China and Germany as competition heats up
Brian Snyder/Reuters
Former JetBlue CEO Robin Hayes to lead Airbus in North America
Mike Blake/Reuters
TikTok could face EU fines and a suspension over sister app TikTok Lite
Andy Lyons/Getty Images/File
Caitlin Clark will reportedly sign a sneaker deal with Nike
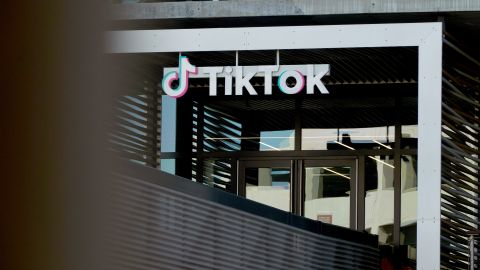
TikTok vows legal challenge to potential US app ban
The ‘halving’ — bitcoin bros’ World Cup — is here
Express files for bankruptcy; closing more than 100 stores
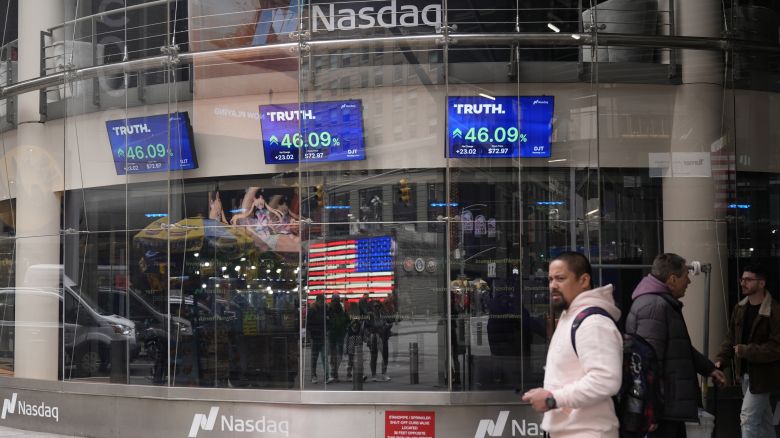
Donald Trump is on the verge of another $1 billion Truth Social windfall
Brits face biggest obstacles in 70 years to buying a first home
These supersized clownfish robots could be coming to waterways in the Middle East
Investors are fearful. They shouldn’t be
What a buyer’s agent will do for you when you’re looking for a new home
The Mona Lisa rapping? New Microsoft AI animates faces from photos
Should the SAT still matter after all these years? Why some colleges are bringing it back
The US dollar is strengthening. Here’s what’s driving the rally and what it means for Americans
The House just voted on a potential TikTok ban (again). Now what?
House passes legislation that could ban TikTok in the US amid high-stakes vote on foreign aid
Ad Feedback
Quote Search
Market Movers
ACTIVES
GAINERS
LOSERS
$ Price
% Change
Ad Feedback
What to Watch
•
Video
1:55
Video
Jon Stewart lampoons media’s coverage of Trump’s first day at trial
1:55
CNN
•
Video
4:51
Video
Luxury downturn doesn’t spook Swiss watch bosses
4:51
CNN
•
Video
5:37
Video
Old classics, new faces: Watch brands rework classic designs
5:37
CNN
•
Video
0:53
Video
Meet the 26-year-old entrepreneur changing the face of Uzbekistan’s art scene
0:53
Ad Feedback
In Case You Missed It
Remko de Waal/ANP/AFP/Getty Images
Police take down $249-a-month global phishing service used by 2,000 hackers
US regional banks are still under pressure. That’s likely to continue
Led by stars like Taylor Swift and Caitlin Clark, women keep breaking boundaries (and records) in entertainment
Google fires 28 employees for protesting Israel cloud deal
Frank Franklin II/AP
Trump Media stock ends session 15% higher after two very bad days
Mickey, Minnie, Donald and Goofy file for union vote at Disneyland
NPR editor who penned scathing piece criticizing the public broadcaster resigns
America’s debt problem is storing up trouble for the rest of the world
Ad Feedback
Ad Feedback
More from Video
•
Video
24:59
Vaquita: The Business of Extinction
24:59
•
Video
2:20
CNN writer explains how Microsoft’s new AI model works
2:20
CNN
•
Video
3:02
How Grammy nominee is using music and film to fight climate change
3:02
CNN
•
Video
2:31
The US may be on the verge of a ‘doom loop.’ Can this fix it?
2:31
CNN
•
Video
2:46
This restauranteur says her middle-aged staff are the key to her success
2:46
Success
mapodile/E+/Getty Images
How to make high interest rates work for your hard-earned savings
Michael Nagle/Bloomberg/Getty Images
The average Wall Street bonus dipped 2% last year, to $176,500
PeopleImages/iStockphoto/Getty Images
The average tax refund is over $3,000. Here are 7 ways to put it to good use
FS Productions/Tetra images RF/Getty Images
March 12 marks Equal Pay Day this year
Tech
Bing Guan/Bloomberg/Getty Images
FTC investigating TikTok over privacy and security
Philip Pacheco/Bloomberg via Getty Images
Apple announces its annual developers conference is set for June 10
Kirsty Wigglesworth/Pool/Reuters/FILE
Judge’s stern rebuke of Elon Musk’s X gives researchers fresh hope
Michael Kappeler/dpa/picture-alliance/Sipa
3 ways Apple’s monopoly lawsuit could change the iPhone experience for fans
Media
Michael M. Santiago/Getty Images
NBC cut ties with Ronna McDaniel after extraordinary pressure, but its problems aren’t over
Mandel Ngan/AFP/Getty Images
NBC News ousts Ronna McDaniel after network’s anchors launch unprecedented on-air rebellion
Melina Mara/The Washington Post/Getty Images
NBC News boss Cesar Conde faces backlash from his network’s anchors over ‘inexplicable’ decision to hire ex-RNC chair Ronna McDaniel
Mike Segar/Reuters
NBC hires former RNC chair Ronna McDaniel, who has demonized the press and refused to acknowledge Biden was fairly elected
Un
derscored Money
Delta Air Lines
Your ultimate guide to the American Express Membership Rewards program
AlexImages/iStock Editorial/Getty Images
Bilt’s March Rent Day promotion: Vote for your favorite benefit with the Bilt Bracket
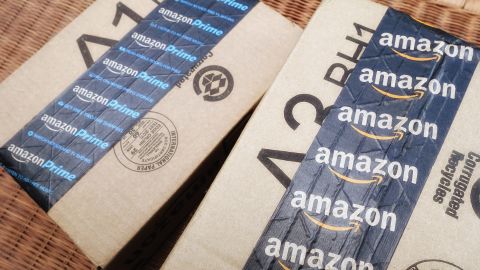
iStock
It’s back: Targeted Amex card holders can get up to 30% off at Amazon
Emily McNutt
Your complete guide to earning and redeeming points in the Citi ThankYou Rewards program
Sum Vivas
Digital humans: the relatable face of artificial intelligence?
Top soccer clubs are using an AI-powered app to scout future stars
Why lab-grown diamond sales are surging
The Chevrolet Corvette is officially going electric
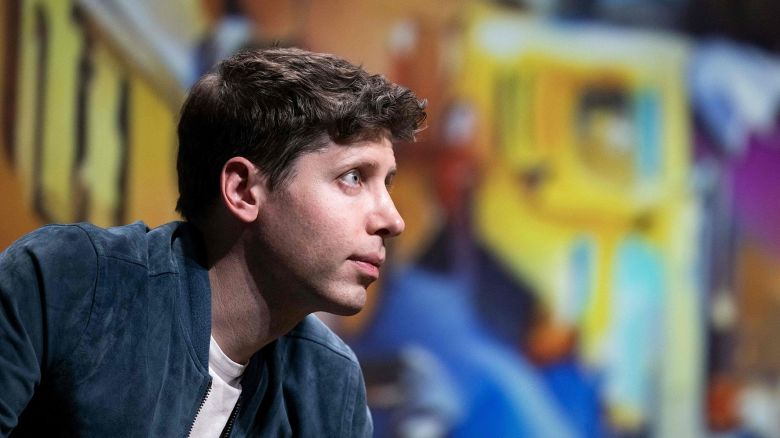
Joel Saget/AFP/Getty Images
OpenAI’s wild week. How the Sam Altman story unfolded
Sam Altman returns to OpenAI in a bizarre reversal of fortunes
Opinion: The drama around Sam Altman is an urgent warning
Microsoft stock hits all-time high after hiring former OpenAI CEO Sam Altman
Paid Partner Content