FORTUNE 500 Headquarters
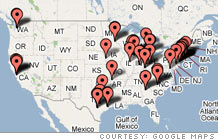
Click to enlarge
Show FORTUNE 500 Companies:
| 401 |
Foot Locker
|
5,750.0 |
251.0 |
| 402 |
Reliance Steel & Alum.
|
5,748.4 |
354.5 |
| 403 |
Hormel Foods
|
5,745.5 |
286.1 |
| 404 |
Darden Restaurants
|
5,720.6 |
338.2 |
| 405 |
Avis Budget Group
|
5,689.0 |
-1,994.0 |
| 406 |
Mattel
|
5,650.2 |
592.9 |
| 407 |
Advanced Micro Devices
|
5,649.0 |
-166.0 |
| 408 |
Kelly Services
|
5,639.0 |
63.5 |
| 409 |
Charter Communications
|
5,613.0 |
-1,370.0 |
| 410 |
Blockbuster
|
5,611.3 |
54.7 |
| 411 |
Whole Foods Market
|
5,607.4 |
203.8 |
| 412 |
Avery Dennison
|
5,583.1 |
367.2 |
| 413 |
Tribune
|
5,582.6 |
594.0 |
| 414 |
Temple-Inland
|
5,581.0 |
468.0 |
| 415 |
Ross Stores
|
5,570.2 |
241.6 |
| 416 |
Rockwell Automation
|
5,561.4 |
607.0 |
| 417 |
Triad Hospitals
|
5,537.9 |
222.3 |
| 418 |
Owens & Minor
|
5,533.7 |
48.8 |
| 419 |
Leggett & Platt
|
5,505.4 |
300.3 |
| 420 |
Beazer Homes USA
|
5,462.0 |
388.8 |
| 421 |
AGCO
|
5,435.0 |
-64.9 |
| 422 |
Stryker
|
5,405.6 |
777.7 |
| 423 |
W.R. Berkley
|
5,394.8 |
699.5 |
| 424 |
Affiliated Computer Svcs.
|
5,353.7 |
358.8 |
| 425 |
Wesco International
|
5,320.6 |
217.3 |
| 426 |
GameStop
|
5,318.9 |
158.2 |
| 427 |
Mosaic
|
5,305.8 |
-121.4 |
| 428 |
Timken
|
5,301.5 |
222.5 |
| 429 |
Micron Technology
|
5,272.0 |
408.0 |
| 430 |
Barnes & Noble
|
5,261.3 |
150.8 |
| 431 |
Peabody Energy
|
5,256.3 |
600.7 |
| 432 |
Pilgrim's Pride
|
5,235.6 |
-34.2 |
| 433 |
Hexion Specialty Chemicals
|
5,233.0 |
-109.0 |
| 434 |
Energy East
|
5,230.7 |
259.8 |
| 435 |
UGI
|
5,221.0 |
176.2 |
| 436 |
Pantry
|
5,211.2 |
89.2 |
| 437 |
Pacific Life
|
5,201.9 |
613.1 |
| 438 |
Henry Schein
|
5,191.0 |
163.8 |
| 439 |
Corning
|
5,174.0 |
1,855.0 |
| 440 |
Avaya
|
5,148.0 |
201.0 |
| 441 |
Marshall & Ilsley Corp.
|
5,127.9 |
807.8 |
| 442 |
Lexmark International
|
5,108.1 |
338.4 |
| 443 |
Longs Drug Stores
|
5,097.1 |
74.5 |
| 444 |
Auto-Owners Insurance
|
5,090.1 |
634.3 |
| 445 |
Franklin Resources
|
5,050.7 |
1,267.6 |
| 446 |
Peter Kiewit Sons'
|
5,049.0 |
39.0 |
| 447 |
Newmont Mining
|
5,039.0 |
791.0 |
| 448 |
Emcor Group
|
5,021.0 |
86.6 |
| 449 |
El Paso
|
5,011.0 |
475.0 |
| 450 |
Graybar Electric
|
5,009.1 |
57.4 |
| 451 |
Liz Claiborne
|
4,994.3 |
254.7 |
| 452 |
Host Hotels & Resorts
|
4,958.0 |
738.0 |
| 453 |
Hershey
|
4,944.2 |
559.1 |
| 454 |
Anixter International
|
4,938.6 |
209.3 |
| 455 |
Allegheny Technologies
|
4,936.6 |
571.9 |
| 456 |
BlueLinx Holdings
|
4,899.4 |
15.8 |
| 457 |
Ecolab
|
4,895.8 |
368.6 |
| 458 |
DaVita
|
4,880.7 |
289.7 |
| 459 |
H&R Block
|
4,872.8 |
490.4 |
| 460 |
Western & Southern Financial
|
4,838.1 |
387.4 |
| 461 |
MDC Holdings
|
4,801.7 |
214.3 |
| 462 |
Frontier Oil
|
4,796.0 |
379.3 |
| 463 |
Erie Insurance Group
|
4,785.5 |
204.0 |
| 464 |
Shaw Group
|
4,781.4 |
50.9 |
| 465 |
Level 3 Communications
|
4,778.0 |
-744.0 |
| 466 |
RadioShack
|
4,777.5 |
73.4 |
| 467 |
Ryland Group
|
4,757.2 |
359.9 |
| 468 |
Aleris International
|
4,748.8 |
70.3 |
| 469 |
Big Lots
|
4,743.0 |
124.0 |
| 470 |
Jones Apparel Group
|
4,742.8 |
-144.1 |
| 471 |
SPX
|
4,723.0 |
170.7 |
| 472 |
Wm. Wrigley Jr.
|
4,686.0 |
529.4 |
| 473 |
Tenneco
|
4,685.0 |
51.0 |
| 474 |
Mirant
|
4,684.0 |
1,864.0 |
| 475 |
Clorox
|
4,660.0 |
444.0 |
| 476 |
Nash-Finch
|
4,631.6 |
-23.0 |
| 477 |
Expeditors Intl. of Washington
|
4,626.0 |
235.1 |
| 478 |
Advance Auto Parts
|
4,616.5 |
231.3 |
| 479 |
Sovereign Bancorp
|
4,612.0 |
136.9 |
| 480 |
Constellation Brands
|
4,603.4 |
325.3 |
| 481 |
BorgWarner
|
4,585.4 |
211.6 |
| 482 |
XTO Energy
|
4,576.0 |
1,860.0 |
| 483 |
SCANA
|
4,563.0 |
310.0 |
| 484 |
Cincinnati Financial
|
4,550.0 |
930.0 |
| 485 |
United Stationers
|
4,546.9 |
132.2 |
| 486 |
Fiserv
|
4,544.2 |
449.9 |
| 487 |
Comerica
|
4,539.0 |
893.0 |
| 488 |
Chiquita Brands Intl.
|
4,499.1 |
-95.9 |
| 489 |
Mutual of Omaha Ins.
|
4,497.6 |
80.2 |
| 490 |
Northern Trust Corp.
|
4,473.0 |
665.4 |
| 491 |
Global Partners
|
4,472.4 |
33.5 |
| 492 |
Western Union
|
4,470.2 |
914.0 |
| 493 |
Conseco
|
4,467.4 |
96.5 |
| 494 |
Community Health Sys.
|
4,369.9 |
168.3 |
| 495 |
BJ Services
|
4,367.9 |
804.6 |
| 496 |
M&T Bank Corp.
|
4,359.9 |
839.2 |
| 497 |
Kindred Healthcare
|
4,355.9 |
78.7 |
| 498 |
Western Digital
|
4,341.3 |
394.6 |
| 499 |
Sealed Air
|
4,327.9 |
274.1 |
| 500 |
SunGard Data Systems
|
4,323.0 |
-118.0 |
From the April 30th, 2007 issue
|
| Most profitable companies |
| Fortune 500 methodology |
| Included in the survey are U.S. incorporated companies filing financial statements with a government agency. This includes private companies... (more)
|
|