Search News
Symbol Matches
Symbol Starts With
Company Matches
Industries
| REVENUES | PROFITS | |||||
|---|---|---|---|---|---|---|
| Rank | Company | Fortune 1000 rank | $ millions | % change from 2007 | $ millions | % change from 2007 |
| 1 | Merrill Lynch | 150 | 16,784.0 | -73.9 | -27,612.0 | N.A. |
| 2 | Franklin Resources | 410 | 6,032.4 | -2.8 | 1,588.2 | -10.4 |
| 3 | Charles Schwab | 440 | 5,393.0 | -11.1 | 1,212.0 | -49.6 |
| 4 | BlackRock | 469 | 5,063.9 | 4.5 | 786.4 | -21.0 |
| 5 | NYSE Euronext | 477 | 4,951.0 | 19.1 | -738.0 | -214.8 |
| 6 | Legg Mason | 500 | 4,634.1 | 6.7 | 267.6 | -58.6 |
| 7 | Jones Financial | 568 | 3,859.0 | -6.9 | 311.8 | -38.6 |
| 8 | Nasdaq OMX Group | 593 | 3,648.7 | 49.7 | 319.9 | -38.3 |
| 9 | Raymond James Financial | 657 | 3,204.9 | 3.1 | 235.1 | -6.1 |
| 10 | E*Trade Financial | 659 | 3,188.2 | 43.4 | -511.8 | N.A. |
| 11 | TD Ameritrade | 720 | 2,787.0 | 5.9 | 803.9 | 24.5 |
| 12 | CME Group | 761 | 2,561.0 | 45.8 | 715.5 | 8.6 |
| 13 | Interactive Brokers Group | 851 | 2,182.1 | 7.8 | 93.0 | -69.0 |
| 14 | T. Rowe Price | 871 | 2,121.3 | -5.0 | 490.8 | -26.8 |
| Rank | Company | Revenues % | Assets % | Stockholders' Equity % |
|---|---|---|---|---|
| 1 | Merrill Lynch | -164.5 | -4.1 | -138.0 |
| 2 | Franklin Resources | 26.3 | 17.3 | 22.5 |
| 3 | Charles Schwab | 22.5 | 2.3 | 29.8 |
| 4 | BlackRock | 15.5 | 3.9 | 6.5 |
| 5 | NYSE Euronext | -14.9 | -5.3 | -11.3 |
| 6 | Legg Mason | 5.8 | 2.3 | 4.0 |
| 7 | Jones Financial | 8.1 | 4.5 | 21.1 |
| 8 | Nasdaq OMX Group | 8.8 | 2.5 | 7.5 |
| 9 | Raymond James Financial | 7.3 | 1.1 | 12.5 |
| 10 | E*Trade Financial | -16.1 | -1.1 | -19.7 |
| 11 | TD Ameritrade | 28.8 | 5.0 | 27.5 |
| 12 | CME Group | 27.9 | 1.5 | 3.8 |
| 13 | Interactive Brokers Group | 4.3 | 0.3 | 18.1 |
| 14 | T. Rowe Price | 23.1 | 17.4 | 19.7 |
| EARNINGS PER SHARE | TOTAL RETURN TO INVESTORS | EMPLOYEES | ||||
|---|---|---|---|---|---|---|
| Rank | Company | 1998-2008 Annual growth (%) | 1998-2008 Annual rate (%) | 2008 (%) | Number | % change from 2007 |
| 1 | Merrill Lynch | N.A. | -8.4 | -77.1 | 55,190 | -14.0 |
| 2 | Franklin Resources | 12.9 | 8.2 | -43.7 | 8,800 | 1.1 |
| 3 | Charles Schwab | 14.0 | -0.4 | -36.0 | 13,400 | 0.8 |
| 4 | BlackRock | N.A. | N.A. | -37.0 | 5,341 | -10.3 |
| 5 | NYSE Euronext | N.A. | N.A. | -67.9 | 3,757 | -16.2 |
| 6 | Legg Mason | 7.8 | 1.4 | -69.4 | 4,220 | 4.7 |
| 7 | Jones Financial | N.A. | N.A. | N.A. | 40,000 | 5.0 |
| 8 | Nasdaq OMX Group | N.A. | N.A. | -50.1 | 2,507 | 181.4 |
| 9 | Raymond James Financial | 9.1 | 7.5 | -46.6 | 6,900 | 147.8 |
| 10 | E*Trade Financial | N.A. | -20.7 | -67.6 | 3,249 | -14.5 |
| 11 | TD Ameritrade | N.A. | 13.5 | -29.0 | 4,660 | 20.0 |
| 12 | CME Group | N.A. | N.A. | -68.8 | 2,300 | 16.8 |
| 13 | Interactive Brokers Group | N.A. | N.A. | -44.6 | 750 | 11.1 |
| 14 | T. Rowe Price | 10.5 | 9.3 | -40.3 | 5,385 | 6.0 |
Issue date: May 4, 2009
Find your top companies
Video
-
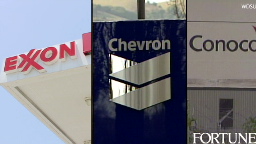
 Exxon Mobil shoved aside Wal-Mart to retake the No. 1 slot. But the Fortune 500 had its worst slump ever. Watch
 -
The group harnesses the power of Fortune 500 brand names to fight disease in Africa. Watch
-
Centerpoint, a partner of IBM, No. 14 on the Fortune 500, is using technology to make the power grid smarter. Watch
-
The social network offers companies new ways to reach customers. Will it make the Fortune 500 someday? Watch
-
No. 29 on the Fortune 500, J&J invests for the long term in people and research. Watch
-
 The San Francisco-based bank, No. 41 on the Fortune 500, faces growing pains integrating with Wachovia. Watch
| Rank # of Fortune 500 Companies | |
|---|---|
| Texas | 64 |
| New York | 56 |
| California | 51 |
| Company | Rank |
|---|---|
| Valero Energy | 10 |
| Microsoft | 35 |
| Goldman Sachs | 40 |
| Company | 2008 $ (millions) |
|---|---|
| Exxon Mobil | $45,220.0 |
| Chevron | $23,931.0 |
| Microsoft | $17,681.0 |
FAQ and methodology
Included in the survey are U.S. incorporated companies filing financial statements with a government agency. This includes private companies... More


