Our annual ranking of America's largest corporations

  • All
    companies
  • All
    industries
Top companies: Most profitable
Rank Company 500 Rank 2008 Profits as % of Equity
1 AutoZone 380 279.3
2 Altria Group 160 174.3
3 Celanese 368 154.9
4 Avon Products 255 129.7
5 Lockheed Martin 54 112.3
6 Colgate-Palmolive 166 101.8
7 Hershey 463 97.9
8 Philip Morris International 93 91.9
9 International Business Machines 14 91.6
10 Campbell Soup 309 88.4
11 Kellogg 210 79.3
12 Express Scripts 115 72.0
13 McGraw-Hill 391 62.3
14 Caterpillar 44 58.4
15 Dell 33 58.0
16 FMC Technologies 460 51.9
17 NCR 446 51.8
18 Microsoft 35 48.7
19 Gilead Sciences 444 48.4
20 Rockwell Collins 488 48.2
21 H.J. Heinz 267 44.8
22 United Parcel Service 43 44.3
23 Kimberly-Clark 128 43.6
24 United States Steel 105 43.1
25 Bristol-Myers Squibb 120 42.9
26 PepsiCo 52 42.5
27 Merck 103 41.6
28 TJX 131 41.3
29 Exxon Mobil 1 40.0
30 Corning 414 39.1
31 Honeywell International 63 38.8
32 Huntsman 262 37.8
33 International Assets Holding 140 37.2
34 3M 95 35.0
35 Loews 174 34.5
36 Rockwell Automation 429 34.2
37 AES 158 33.6
38 Nordstrom 301 33.1
39 Dean Foods 216 32.9
40 Peabody Energy 353 32.8
41 Goodrich 354 32.6
42 C.H. Robinson Worldwide 300 32.4
43 Sysco 62 32.4
44 Baxter International 219 32.3
45 Western Digital 319 32.2
46 McDonald's 107 32.2
47 Deere 87 31.4
48 Best Buy 56 31.4
49 DirecTV Group 126 31.3
50 Harley-Davidson 412 30.9
Issue date: May 4, 2009
Top 50
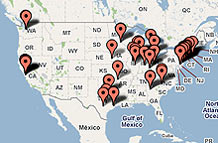
Headquarters
MAPS
What Readers Say
They speak out on Exxon Mobil and other 500 companies...


Find your top companies
 High revenue growth  High profit growth
 High EPS growth  High return to investors
 Top 5 in its industry  Best company to work for
 Big employer  Small employer


Video

Rank # of Fortune 500 Companies
Texas 64
New York 56
California 51
Company 2008 $ (millions)
Exxon Mobil $45,220.0
Chevron $23,931.0
Microsoft $17,681.0
FAQ and methodology
Included in the survey are U.S. incorporated companies filing financial statements with a government agency. This includes private companies... More
Current Issue
  • Give the gift of Fortune
  • Get the Fortune app
  • Subscribe

Most stock quote data provided by BATS. Market indices are shown in real time, except for the DJIA, which is delayed by two minutes. All times are ET. Disclaimer. Morningstar: © 2018 Morningstar, Inc. All Rights Reserved. Factset: FactSet Research Systems Inc. 2018. All rights reserved. Chicago Mercantile Association: Certain market data is the property of Chicago Mercantile Exchange Inc. and its licensors. All rights reserved. Dow Jones: The Dow Jones branded indices are proprietary to and are calculated, distributed and marketed by DJI Opco, a subsidiary of S&P Dow Jones Indices LLC and have been licensed for use to S&P Opco, LLC and CNN. Standard & Poor's and S&P are registered trademarks of Standard & Poor's Financial Services LLC and Dow Jones is a registered trademark of Dow Jones Trademark Holdings LLC. All content of the Dow Jones branded indices © S&P Dow Jones Indices LLC 2018 and/or its affiliates.