| Rank |
Company |
Revenues
($ millions) |
Profits
($ millions) |
| 75 | Abbott Laboratories | 30,764.7 | 5,745.8 | | 472 | AbitibiBowater | 4,366.0 | -1,553.0 | | 389 | Advance Auto Parts | 5,412.6 | 270.4 | | 390 | Advanced Micro Devices | 5,403.0 | 376.0 | | 352 | AECOM Technology | 6,192.4 | 189.7 | | 156 | AES | 14,690.0 | 658.0 | | 63 | Aetna | 34,764.1 | 1,276.5 | | 341 | Affiliated Computer Services | 6,523.2 | 349.9 | | 130 | AFLAC | 18,254.4 | 1,497.0 | | 337 | AGCO | 6,630.4 | 135.7 | | 461 | Agilent Technologies | 4,481.0 | -31.0 | | 273 | Air Products & Chemicals | 8,381.4 | 631.3 | | 474 | Airgas | 4,349.5 | 261.1 | | 127 | Alcoa | 18,745.0 | -1,151.0 | | 459 | Allergan | 4,503.6 | 621.3 | | 454 | Alliant Techsystems | 4,583.2 | 155.1 | | 68 | Allstate | 32,013.0 | 854.0 | | 137 | Altria Group | 16,824.0 | 3,206.0 | | 100 | Amazon.com | 24,509.0 | 902.0 | | 320 | Ameren | 7,090.0 | 612.0 | | 172 | American Electric Power | 13,489.0 | 1,357.0 | | 88 | American Express | 26,730.0 | 2,130.0 | | 344 | American Family Insurance Group | 6,453.4 | 256.9 | | 478 | American Financial Group | 4,320.6 | 519.3 | | 16 | American International Group | 103,189.0 | -10,949.0 | | 404 | Amerigroup | 5,188.1 | 149.3 | | 288 | Ameriprise Financial | 7,946.0 | 722.0 | | 24 | AmerisourceBergen | 71,789.0 | 503.4 | | 159 | Amgen | 14,642.0 | 4,605.0 | | 120 | AMR | 19,917.0 | -1,468.0 | | 260 | Anadarko Petroleum | 9,000.0 | -135.0 | | 422 | Anixter International | 4,982.4 | -29.3 | | 298 | Aon | 7,595.0 | 747.0 | | 271 | Apache | 8,614.8 | -284.4 | | 56 | Apple | 36,537.0 | 5,704.0 | | 421 | Applied Materials | 5,013.6 | -305.3 | | 189 | Aramark | 12,297.9 | -6.9 | | 27 | Archer Daniels Midland | 69,207.0 | 1,707.0 | | 157 | Arrow Electronics | 14,684.1 | 123.5 | | 450 | ArvinMeritor | 4,617.0 | -1,212.0 | | 280 | Ashland | 8,106.0 | 71.0 | | 268 | Assurant | 8,700.5 | 430.6 | | 424 | Atmos Energy | 4,969.1 | 191.0 | | 7 | AT&T | 123,018.0 | 12,535.0 | | 410 | Autoliv | 5,120.7 | 10.0 | | 265 | Automatic Data Processing | 8,867.1 | 1,332.6 | | 212 | AutoNation | 11,015.6 | 198.0 | | 418 | Auto-Owners Insurance | 5,017.1 | 327.1 | | 329 | AutoZone | 6,816.8 | 657.0 | | 362 | Avery Dennison | 5,952.7 | -746.7 | | 409 | Avis Budget Group | 5,131.0 | -47.0 | | 142 | Avnet | 16,229.9 | -1,122.5 | | 228 | Avon Products | 10,382.8 | 625.8 |
|
Interactives
-
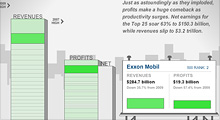
See how revenues and profits at America's 25 largest companies have risen and fallen over the past decade.
-
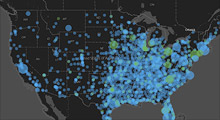
From a single store in 1962 to more than 4,300 outlets today, see how the biggest retailer has expanded.
|


