Our annual ranking of America's largest corporations

69 of 500
BACKNEXT
69. General Dynamics
Financials: Latest Results
Rank: 69 (Previous rank: 83)
CEO: Jay L. Johnson
Compare tool: General Dynamics vs. Top 10
Subscribe to Fortune Magazine
Is General Dynamics a great company, or what?
Key financials $ millions % change
from 2008
Revenues 31,981.0 9.1
Profits 2,394.0 -2.6
Assets 31,077.0
Stockholders' equity 12,423.0
Market value (3/26/2010) 29,670.0
Profits as % of  
Revenues 7.5
Assets 7.7
Stockholders' equity 19.3
Earnings per share  
2009 $ 6.17
% change from 2008 0.0
1999-2009 annual growth rate % 11.0
Total return to investors %
2009 21.4
1999-2009 annual rate 11.7
Rank Company 500
rank
Revenues
($ millions)
1 Boeing 28 68,281.0
2 United Technologies 37 52,920.0
3 Lockheed Martin 44 45,189.0
4 Northrop Grumman 61 35,291.0
5 General Dynamics 69 31,981.0
6 Honeywell International 74 30,908.0
7 Raytheon 95 24,881.0
8 L-3 Communications 148 15,615.0
9 ITT 214 10,904.5
10 Textron 220 10,548.0
11 Precision Castparts 325 6,913.8
12 Goodrich 334 6,685.6
13 Alliant Techsystems 454 4,583.2
14 Rockwell Collins 462 4,470.0
Issue date: May 3, 2010.
Interactives
  • A changing landscape
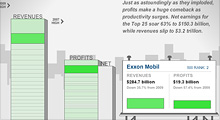
    See how revenues and profits at America's 25 largest companies have risen and fallen over the past decade.
  • Watch Wal-Mart grow
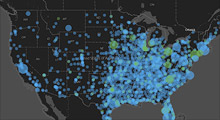
    From a single store in 1962 to more than 4,300 outlets today, see how the biggest retailer has expanded.
Headquarters
MAPS
General Dynamics
2941 Fairview Park Dr.
Falls Church, VA 22042
703-876-3000
www.generaldynamics.com
Find your top companies
 High revenue growth  High profit growth
 High EPS growth  High return to investors
 Top 5 in its industry  Best company to work for
 Big employer  Small employer


Video

Rank # of Fortune 500 Companies
California 57
Texas 57
New York 56
Company 2009 $ (millions)
Exxon Mobil $19,280.0
Microsoft $14,569.0
Wal-Mart Stores $14,335.0
FAQ and methodology
Included in the survey are U.S. incorporated companies filing financial statements with a government agency. This includes private companies... More
Current Issue
  • Give the gift of Fortune
  • Get the Fortune app
  • Subscribe

Most stock quote data provided by BATS. Market indices are shown in real time, except for the DJIA, which is delayed by two minutes. All times are ET. Disclaimer. Morningstar: © 2018 Morningstar, Inc. All Rights Reserved. Factset: FactSet Research Systems Inc. 2018. All rights reserved. Chicago Mercantile Association: Certain market data is the property of Chicago Mercantile Exchange Inc. and its licensors. All rights reserved. Dow Jones: The Dow Jones branded indices are proprietary to and are calculated, distributed and marketed by DJI Opco, a subsidiary of S&P Dow Jones Indices LLC and have been licensed for use to S&P Opco, LLC and CNN. Standard & Poor's and S&P are registered trademarks of Standard & Poor's Financial Services LLC and Dow Jones is a registered trademark of Dow Jones Trademark Holdings LLC. All content of the Dow Jones branded indices © S&P Dow Jones Indices LLC 2018 and/or its affiliates.