Companies
|
Top 25 Headquarters 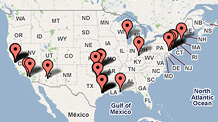 What Readers Say
They speak out on the Fastest-Growing Companies...
|
| Company | Revenue growth (3-year annual rate) |
|---|---|
| Allis-Chalmers Energy | 124% |
| Arena Resources | 117% |
| Nutrisystem | 110% |
| Company | EPS growth (3-year annual rate) |
|---|---|
| Sigma Designs | 294% |
| Sepracor | 228% |
| Hornbeck Offshore Services | 214% |
| Company | Total return (3-year annual rate) |
|---|---|
| Arena Resources | 107% |
| T-3 Energy Services | 101% |
| Steel Dynamics | 84% |
To qualify, a company must be incorporated in the U.S.; have a minimum market capitalization of $250 million on June 30, 2008; have a stock price of at least $5... More
