Find your top companies
 High revenue growth  High profit growth
 Based in Asia  Based in Europe
 Based in U.S.  Top 5 in its industry
 Big employer  Small employer
SUBMIT


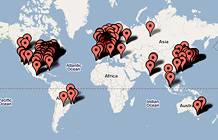
U.S. 153
Japan 64
France 39
U.S. Postal Service 785,929
Sinopec 634,011
Hon Hai Precision Industry 550,000
Exxon Mobil $40,610
Royal Dutch Shell $31,331
General Electric $22,208
FAQ and methodology
All companies on the list must publish financial data and report part or all of their figures to a government agency. In the U.S., private companies and cooperatives... More
Current Issue
  • Give the gift of Fortune
  • Get the Fortune app
  • Subscribe
  • All
    companies
  • All
    industries
340 of 500
BACKNEXT
340. Alliance Boots
Rank: 340 (Previous rank: 328)
CEO: Stefano Pessina
Employees: 110,000
Address: Baarerstrasse 78
Zug  6300
Country: Switzerland
Website: www.allianceboots.com
Revenues 23,812.1 9.5
Profits 20.1 -97.3
Assets 35,363.6
Stockholders' equity 7,975.8
Revenues 0
Assets 0
1 Carrefour 33 115,584.7
2 Tesco 51 94,703.0
3 Metro 56 90,267.1
4 CVS Caremark 80 76,329.5
5 Kroger 87 70,234.7
6 Walgreen 125 53,762.0
7 Royal Ahold 137 50,738.6
8 Groupe Auchan 139 50,464.9
9 Seven & I Holdings 141 49,768.0
10 AEON 154 44,706.5
11 Supervalu 157 44,048.0
12 Safeway 164 42,286.0
13 J. Sainsbury 208 35,797.4
14 Woolworths 228 33,442.0
15 George Weston 254 30,558.5
16 Coles Group 293 27,556.2
17 Delhaize Group 306 26,113.4
18 William Morrison Supermarkets 310 25,960.2
19 Rite Aid 328 24,417.7
20 Alliance Boots 340 23,812.1
21 Publix Super Markets 360 23,193.6
22 Migros 445 18,914.5
From the July 21, 2008 issue
Figures prepared in accordance with International Accounting Standards.
Figures are for fiscal year ended March 31, 2008.
Taken private by Kohlberg Kravis Roberts, June 27, 2007.
See Alliance Boots in...
...Top 50 Headquarters
MAPS
...What Readers Say
They speak out on Alliance Boots and other 500 companies...


Most stock quote data provided by BATS. Market indices are shown in real time, except for the DJIA, which is delayed by two minutes. All times are ET. Disclaimer. Morningstar: © 2018 Morningstar, Inc. All Rights Reserved. Factset: FactSet Research Systems Inc. 2018. All rights reserved. Chicago Mercantile Association: Certain market data is the property of Chicago Mercantile Exchange Inc. and its licensors. All rights reserved. Dow Jones: The Dow Jones branded indices are proprietary to and are calculated, distributed and marketed by DJI Opco, a subsidiary of S&P Dow Jones Indices LLC and have been licensed for use to S&P Opco, LLC and CNN. Standard & Poor's and S&P are registered trademarks of Standard & Poor's Financial Services LLC and Dow Jones is a registered trademark of Dow Jones Trademark Holdings LLC. All content of the Dow Jones branded indices © S&P Dow Jones Indices LLC 2018 and/or its affiliates.