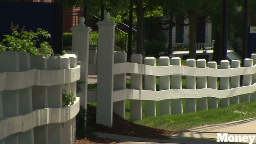
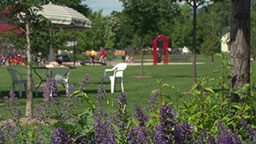
33. Brownsburg, IN
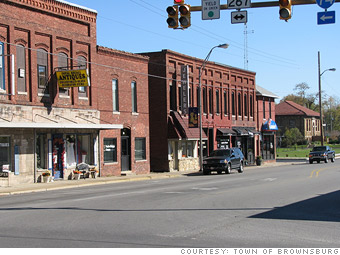
Once a busy junction for horse-drawn wagons, Brownsburg is now intersected by three major highways that allow a quick commute to Indianapolis.
The town is home to O'Reilly Raceway Park -- which hosts over 100 auto-racing events each year and is one of Brownsburg's largest employers -- as well as a handful of professional race-car drivers. Housing is very affordable here. Traffic is an issue, however; the town is working on widening the highways and creating a bypass to alleviate congestion. --D.G. Is Brownsburg a great town, or what?
| |||||||||||||||||||||||||||||||||||||||||||||||||||||||||||||||||||||||||||||||||||||||||||||||||||||||||||||||||||||||||||||||||||||||||||||||||||||||||||||||||||||||||||||||||||||||||
|
Brownsburg stats
|
FORTUNE 500
|
||||||||||||||||||||||||||||||||||||||||||||||||||||||||||||||||||||||||||||||||||||||||||||||||||||||||||||||||||||||||||||||||||||||||||||||||||||||||||||||||||||||||||||||||||||||||
Looking for a new position in the area? Browse opportunities in popular fields or search all openings.
Key Industries
Key Occupations
Money picked the top 100. Now it’s your turn: Which town will be our fan favorite? Become a fan of your town and it might just make it to No. 1. Results updated monthly.
| Town | Become a fan | # of fans |
|---|---|---|
| 1. Louisville, CO | 4,256 | |
| 2. Chanhassen, MN | 2,410 | |
| 3. Papillion, NE | 1,581 | |
| 4. Middleton, WI | 1,481 | |
| 5. Milton, MA | 1,425 |
Video
-


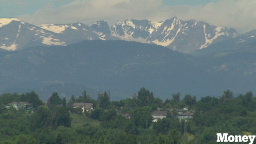 Money's Best Place to Live has it all: affordable housing, great schools, and easy access to the Rocky Mountains. Watch
 -

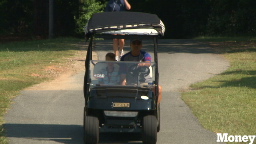 Peachtree City, Ga., No. 8 on Money's Best Places to Live, has 90+ miles of golf cart paths and a family-friendly vibe. Watch
 -
 With beautiful beaches and exciting nightlife, Hermosa Beach, Calif., is a playground for the wealthy and unattached. Watch
 -
 Just minutes from Boston, Milton, Mass., No. 5 on Money's Best Places to Live, offers a quaint New England lifestyle. Watch
 -

 What makes a city tops? We asked folks in some of Money's Best Places to Live what they love about their hometowns. Watch


Using statistics from data provider Onboard Informatics, we crunched the numbers in order to zero in on America's best small towns for families. (Last year, we looked at small cities, with populations between 50,000 and 300,000.)
More
Comments? E-mail the editors
Comments? E-mail the editors