Money's list of America's best small cities


79 of 100
BACK NEXT
79. Millcreek, PA
Millcreek
WINNER
Top 100 rank: 79
Population: 54,000
Compare Millcreek to Top 10 Best Places
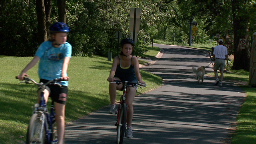
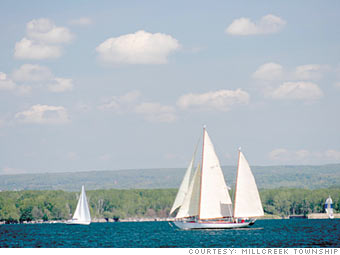
From fishing and boating on Lake Erie in the summer to hunting, hiking, and skiing during the cooler months, there's always something to do in Millcreek.

There are miles of beaches at Presque Isle Park, plus many creeks that provide rich spots for steelhead trout fishermen. And when a craving for city culture hits, Pittsburgh is just a two hour drive away. --N.A.

Subscribe to Money Magazine

Is Millcreek a great town, or what?
Millcreek stats
  City stats Best places avg.
Median family income
(per year)
$70,517 $90,957
Job growth %
(2000-2009)*
-0.53% 15.71%
See jobs near Millcreek
Median home price $144,900 $239,391
See Millcreek homes for sale
Test scores reading
(% above/below state average)
38.6% 22.9%
Test scores math
(% above/below average)
28.3% 22.9%
Personal crime incidents (per 1,000) 23 2
Property crime incidents (per 1,000) 213 24
Restaurants
(within 15 miles)
417 2,967
High temp in July ° F 82.3° 86.2°
Low temp in Jan ° F 14.2° 21.3°
Median age 40.9 35.3
Financial City stats Best places avg.
Median family income
(per year)
$70,517 $90,957
Family purchasing power
(annual, cost-of-living adjusted)
$72,923 $86,860
State sales tax 6.00% 5.45%
State income tax rate
(highest bracket)
N.A. 7.35%
State income tax rate
(lowest bracket)
3.07% 2.96%
Auto insurance premiums
(Average price quotes, for the state)
$2,056 $1,707
Job growth %
(2000-2009)*
-0.53% 15.71%
See jobs near Millcreek
Housing
Median home price $144,900 $239,391
Average property taxes
(2009)
$2,431 $3,418
See Millcreek homes for sale
Education
Colleges, universities and
professional schools (within 30 miles)
5 25
Test scores reading
(% above/below state average)
38.6% 22.9%
Test scores math
(% above/below average)
28.3% 22.9%
% students attending public/private
schools (located within town limits)
77.9/22.1 87.8/12.2
Quality of life
Air quality index*
(% of days AQI ranked as good)
N.A. 77.8%
Personal crime incidents (per 1,000) 23 2
Property crime incidents (per 1,000) 213 24
Median commute time (in minutes) 15.5 21.4
% population with commute
45 mins. or longer
3.3% 13.6%
% population walk or bike to work 1.9% 3.6%
Leisure and culture
Movie theaters
(within 15 miles)
3 31
Restaurants
(within 15 miles)
417 2,967
Bars
(within 15 miles)
115 207
Public golf courses
(within 30 miles)
61 162
Libraries
(within 15 miles)
13 72
Museums (accredited by AAM;
within 30 miles)
N.A. 10
Ski resorts (within 100 miles) 7 12
Arts funding (Dollars per person of state funds spent on arts) 1.0 1.5
Weather
Annual rainfall
(inches)
45.81 37.40
% clear days in the area 17 29
High temp in July ° F 82.3° 86.2°
Low temp in Jan ° F 14.2° 21.3°
Median age 40.9 35.3
Completed at least some college
(% of residents)
58.2% 71.5%
Married % 58.2% 56.6%
Divorced % 8.5% 8.4%
Racial diversity index
(100 is national average; higher numbers indicate greater diversity)
16.5 94.9
From the August 2010 issue
Notes: *County data
(3) Crime incidences are estimates based on FBI 2008 Universal Crime and incidence reports, OnBoard analysis.
  • Homes for sale
  • Real estate and homes for sale on Trulia
Find Your Best Places
Region
Northeast South
Midwest West
Ranking
Top 100 winners only
Population
8.4M
46,000
Home Prices
2009 median sales prices
$1.2M
$36K
Video
Using statistics from data provider Onboard Informatics, we crunched the numbers in order to zero in on America's best small cities for families. (Last year, we looked at small towns, with populations between 8,500 and 50,000.) More

Comments? E-mail the editors

onboard

Most stock quote data provided by BATS. Market indices are shown in real time, except for the DJIA, which is delayed by two minutes. All times are ET. Disclaimer. Morningstar: © 2018 Morningstar, Inc. All Rights Reserved. Factset: FactSet Research Systems Inc. 2018. All rights reserved. Chicago Mercantile Association: Certain market data is the property of Chicago Mercantile Exchange Inc. and its licensors. All rights reserved. Dow Jones: The Dow Jones branded indices are proprietary to and are calculated, distributed and marketed by DJI Opco, a subsidiary of S&P Dow Jones Indices LLC and have been licensed for use to S&P Opco, LLC and CNN. Standard & Poor's and S&P are registered trademarks of Standard & Poor's Financial Services LLC and Dow Jones is a registered trademark of Dow Jones Trademark Holdings LLC. All content of the Dow Jones branded indices © S&P Dow Jones Indices LLC 2018 and/or its affiliates.