BACK NEXT
1. Santa Rosa, CA
Santa Rosa
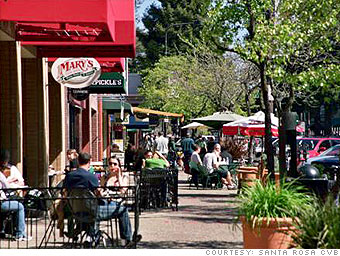
Home price forecast (1 year):* 6.0%
Many cities close to the Bay Area saw a huge run-up in home prices during the boom as real estate buyers branched out to less expensive markets. Santa Rosa, the largest city in northern California's wine country, was no exception: Prices grew more than 121% from 2000 to the early 2006 peak.

They've since plunged more than 45%. But forecasts show the decline is over and Santa Rosa prices will gain 6% this year, more than any other U.S. city. --Les Christie
See Santa Rosa on Money's Best Places to Live
Is this a good time to buy a home in Santa Rosa?
Population:
(2006)
466,891
Median family income:
(2008)
$77,800
Median home price:
(2009)
$345,000
Affordability index:
(Median home price/family income 2009)
4.4
Prices peaked in: 2006:Q1
Total climb during the boom:
(2000 to peak)
121.7%
Total decline so far:
(Peak through 2009)
-45.6%
One-year change:
(Q4 2008 to Q4 2009)
-5.9%
Additional price change to bottom: -6.4%
When they'll hit bottom: 2010:Q1
*(Q1 2010 - Q1 2011)
† Data is for Santa Rosa-Petaluma, CA Metropolitan Statistical Area
Notes:
Median home prices are for single-family homes through the third quarter of 2009, the most recent data available, and include sales of bank-owned properties.
Sources: Fiserv and Moody's Economy.com
Click map to enlarge
Show: Homes for sale | Top 25 drops | Top 25 gains
More places in California
  • Find Homes for sale
    Real estate and homes for sale on Trulia

  • Property Type
  • Find a home in:
  • New York | Atlanta | Chicago | Los Angeles
  • Washington D.C | Houston | Philadelphia | More options

Most stock quote data provided by BATS. Market indices are shown in real time, except for the DJIA, which is delayed by two minutes. All times are ET. Disclaimer. Morningstar: © 2018 Morningstar, Inc. All Rights Reserved. Factset: FactSet Research Systems Inc. 2018. All rights reserved. Chicago Mercantile Association: Certain market data is the property of Chicago Mercantile Exchange Inc. and its licensors. All rights reserved. Dow Jones: The Dow Jones branded indices are proprietary to and are calculated, distributed and marketed by DJI Opco, a subsidiary of S&P Dow Jones Indices LLC and have been licensed for use to S&P Opco, LLC and CNN. Standard & Poor's and S&P are registered trademarks of Standard & Poor's Financial Services LLC and Dow Jones is a registered trademark of Dow Jones Trademark Holdings LLC. All content of the Dow Jones branded indices © S&P Dow Jones Indices LLC 2018 and/or its affiliates.