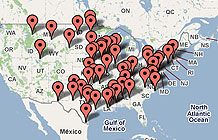
These metro areas had the slowest GDP growth from 2001-2006.
| Rank | Metro area | GDP growth | GDP (in millions) | Population | | 1 | Muncie, IN | 3% | $3,147 | 114,685 | | 2 | Saginaw, MI | 4% | $6,592 | 200,745 | | 3 | Springfield, OH | 5% | $3,384 | 139,859 | | 4 | Kokomo, IN | 6% | $3,741 | 99,304 | | 5 | Anderson, IN | 6% | $3,109 | 131,501 | | 6 | Flint, MI | 7% | $12,092 | 428,790 | | 7 | Harrisonburg, VA | 8% | $4,822 | 118,409 | | 8 | Boulder, CO | 8% | $16,263 | 293,161 | | 9 | Rocky Mount, NC | 9% | $5,199 | 146,356 | | 10 | Macon, GA | 9% | $7,345 | 230,777 | | 11 | Detroit, MI | 9% | $199,288 | 4,425,110 | | 12 | Danville, VA | 9% | $2,694 | 105,783 | | 13 | Springfield, IL | 11% | $7,829 | 207,389 | | 14 | Bay City, MI | 11% | $2,690 | 107,495 | | 15 | Pocatello, ID | 12% | $2,301 | 88,495 | | 16 | Topeka, KS | 13% | $7,974 | 229,619 | | 17 | San Jose, CA | 13% | $135,080 | 1,819,198 | | 18 | Mansfield, OH | 13% | $3,801 | 124,999 | | 19 | Anderson, SC | 13% | $4,378 | 182,825 | | 20 | Hickory, NC | 14% | $11,732 | 363,036 | | 21 | Greenville, SC | 14% | $22,939 | 624,715 | | 22 | Gainesville, GA | 14% | $5,660 | 184,814 | | 23 | Decatur, IL | 14% | $4,680 | 108,328 | | 24 | Albany, GA | 14% | $4,541 | 164,919 | | 25 | Santa Cruz, CA | 15% | $9,709 | 253,137 |
|
|