|
Manufacturing growth slows
|
 |
February 2, 1998: 11:08 a.m. ET
But expansion holds 81-month streak; construction spending edges higher
|
NEW YORK (CNNfn) - The rate of manufacturing activity in the United States slowed in January but still maintained an 81-month streak of increased growth, the National Association of Purchasing Management said Monday.
The NAPM's Purchasing Managers' Index declined to 52.4 percent from 53.1 percent during the previous month. Wall Street economists were looking for the figure to drop back to 52.8 percent.
While the index was lower, it still indicated manufacturing activity was increasing, since a figure above 50 percent shows an expanding manufacturing sector, below 50, a contracting sector.
Each month, the NAPM surveys purchasing managers at the nation's manufacturing companies. It asks them if activity in various parts of their business has picked up or slowed during the month. From those results, the NAPM discerns the strength of U.S. manufacturing.
The NAPM said that supplier deliveries continued to slow, a trend that has been reluctant to change over the past few months.
However, manufacturers continued to cut down in their backlog of orders, and manufacturing employment picked up slightly in January.
Looming large in the minds of many purchasing managers was the effect of Southeast Asia's turmoil. Indeed, according to the survey, exports failed to grow for the first time in 24 months, while imports grew as the effect of the strong dollar made imports from Asia cheaper.
Because of the Asian situation, the NAPM asked special questions of purchasing managers during the month's survey.
Of the 90 percent responding to a question of whether the financial crisis in Asia will affect their business, 48 percent said the situation would have no effect while 45 percent said imported purchases will increase.
Construction spending revives
Separately, the U.S. Commerce Department said that construction spending edged 0.1 percent higher to a seasonally adjusted annual rate of $611 billion during December, reversing a 0.1 percent decrease during the previous month.
Construction spending
Seasonally adjusted annual rate
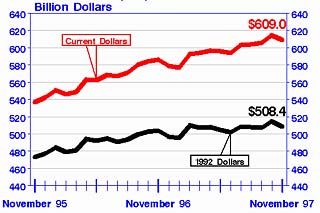
(Source: U.S. Bureau of the Census)
Spending on new housing units rose 1.4 percent to a seasonally adjusted $193.5 billion during December while commercial construction fell 0.4 percent to $159.8 billion. Public construction spending fell 2 percent to $138.9 billion.
Overall, 1997 was a strong year for construction activity, with spending rising to $600.7 billion, 6 percent above the $568.6 billion spent in 1996.
|
|
|
|
|
 |

|