|
Asia woes hit U.S. trade
|
 |
March 19, 1998: 9:50 a.m. ET
Weakening demand from Asia breaks open United States' trade deficit
|
NEW YORK (CNNfn) - The effect of weakening demand from Asia broke open the United States' overall trade gap with the rest of the world in January.
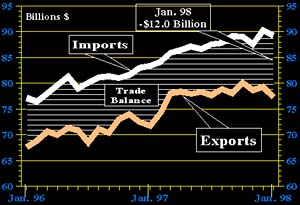
The nation's trade deficit rose 10.5 percent to $12 billion in January, up from a revised figure of $10.9 billion in December. Overall exports decreased to $77.3 billion from $79.4 billion in December while imports decreased to $89.3 billion from $90.2 billion.
Economists had been braced for a deficit of $11 billion. Either way, the figures were bad news for the country's trade picture. The January deficit was the highest since the department began the current balance of payments measurement in 1992.
The U.S. bond market responded calmly as it digested a buffet of economic numbers released simultaneously, including the Consumer Price Index . The benchmark 30-year Treasury bond was up 1/32 with a yield of 5.89 percent, the same level it had been before the figures.
U.S. trade in goods and services
(Source: U.S. Bureau of the Census)
Particularly problematic in the trade figures was the United States' goods deficit, which rose to $18.8 billion in January from $17.7 billion the month before.
Negating some of the force of that figure was the country's service exports, always a strong component for the United States. The nation experienced a trade surplus in services of $6.8 billion. That figure was unchanged from the previous month, however, and could not keep up with the slowing goods exports.
The country's contentious and politically sensitive trade deficit with Japan actually decreased in January to $4.4 billion in January from $5.1 billion the month before.
However, the United States' trade imbalance woes simply moved west as the deficit with China, which is quickly surpassing Japan as the country's largest export thorn, increased 9.7 percent to $4.24 billion.
Especially worrisome could be a trend emerging in the nation's trade with Southeast Asia. That region, which is reeling from currency and debt woes, has changed from an eager market for U.S. goods to one more concerned about putting its economic house in order.
The goods deficit with the Newly Industrialized Countries (Hong Kong, South Korea, Singapore and Taiwan) increased to $2.2 billion from $800 million the previous month. A decrease in exports of aircraft, computers, semiconductors and automobiles and parts was the reason for the significant change, said Commerce.
|
|
|
|
|
 |

|