graphic
Markets & Stocks
Tech plunge swamps Dow
April 19, 1999: 4:14 p.m. ET

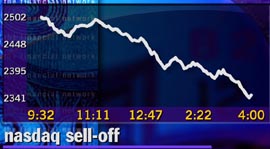
Nasdaq suffers second-worst day ever as investors punish tech stocks, Internets
graphic
graphic graphic
graphic
NEW YORK (CNNfn) - The ailing technology sector deepened its losses Monday, dragging the broader market down with it as investors allowed dread to overcome the morning's supply of strong earnings reports.
     According to preliminary data, the Dow Jones industrial average fell 68.24 points to close at 10,425.65, bringing last week's five-session peak-to-peak rally to an end. Volume on the New York Stock Exchange was a heavy 1.2 billion shares, the market's second-busiest day ever, while advances beat declines by a margin of 1,927 to 1,198.
     The technology-heavy Nasdaq Composite suffered the second-worst one-day plunge in its history, falling 137.17 points, more than 5.5 percent, to 2,346.87. The losses were only slightly behind Aug. 31, 1998, when the index sank 140.43 points.
     The S&P 500 index joined its narrower compatriots in the red, sliding 31.38, nearly 2.4 percent, to 1,287.62.
nasdaq

The bond market profited as stocks' deepening losses drove wary investors back into the comparative safety of government securities. The benchmark 30-year Treasury bond gained 22/32 of a point in price, driving the yield down to 5.52 percent.
     The dollar kept the euro in deep retreat after forcing the European currency to lifetime lows earlier in the session, but slipped against the yen. Back to top

  RELATED STORIES

FTSE 100 hits new peak close - April 19, 1999

Tigers growl as Tokyo slips - April 19, 1999

  RELATED SITES

View the latest market update via Netshow

See how your mutual funds are doing

Learn online trading in Final Bell

Need investing advice? Try Quicken.com on fn

Portfolio manager


Note: Pages will open in a new browser window
External sites are not endorsed by CNNmoney


graphic

Most stock quote data provided by BATS. Market indices are shown in real time, except for the DJIA, which is delayed by two minutes. All times are ET. Disclaimer. Morningstar: © 2018 Morningstar, Inc. All Rights Reserved. Factset: FactSet Research Systems Inc. 2018. All rights reserved. Chicago Mercantile Association: Certain market data is the property of Chicago Mercantile Exchange Inc. and its licensors. All rights reserved. Dow Jones: The Dow Jones branded indices are proprietary to and are calculated, distributed and marketed by DJI Opco, a subsidiary of S&P Dow Jones Indices LLC and have been licensed for use to S&P Opco, LLC and CNN. Standard & Poor's and S&P are registered trademarks of Standard & Poor's Financial Services LLC and Dow Jones is a registered trademark of Dow Jones Trademark Holdings LLC. All content of the Dow Jones branded indices © S&P Dow Jones Indices LLC 2018 and/or its affiliates.

Most stock quote data provided by BATS. Market indices are shown in real time, except for the DJIA, which is delayed by two minutes. All times are ET. Disclaimer. Morningstar: © 2018 Morningstar, Inc. All Rights Reserved. Factset: FactSet Research Systems Inc. 2018. All rights reserved. Chicago Mercantile Association: Certain market data is the property of Chicago Mercantile Exchange Inc. and its licensors. All rights reserved. Dow Jones: The Dow Jones branded indices are proprietary to and are calculated, distributed and marketed by DJI Opco, a subsidiary of S&P Dow Jones Indices LLC and have been licensed for use to S&P Opco, LLC and CNN. Standard & Poor's and S&P are registered trademarks of Standard & Poor's Financial Services LLC and Dow Jones is a registered trademark of Dow Jones Trademark Holdings LLC. All content of the Dow Jones branded indices © S&P Dow Jones Indices LLC 2018 and/or its affiliates.