|
Retail prices surge in April
|
 |
May 14, 1999: 9:52 a.m. ET
April rise of 0.7% biggest since October 1990; energy, apparel propel increase
|
NEW YORK (CNNfn) - Consumer prices soared 0.7 percent in April, the biggest increase in more than eight years, the Labor Department reported Friday -- a sign of rebounding inflation that immediately sent bond and stock prices plummeting.
The index, a key measure of inflationary forces, far exceeded the 0.4 percent consensus forecast of analysts surveyed by Reuters. It was the biggest one-month jump since October 1990, when the index also rose 0.7 percent just prior to the Gulf War.
Much of the April increase was attributed to rising oil prices. But even excluding the volatile energy and food sectors, the index's core rate, rose 0.4 percent on surging apparel, tobacco and lodging prices. That compares with analysts' predictions of a 0.2 percent rise, and follows increases of 0.1 percent in each of the first three months of the year.
The April data caused immediate speculation among traders that the Federal Reserve policymakers might raise interest rates at their meeting on Tuesday in an effort to stem the growth of the economy.
Bond yields soared to their highest levels in a year and stocks plummeted. The Dow industrials dropped nearly 100 points in the first few minutes of trading.

Clothing prices were one factor in the CPI's surge
"I say here we go," Jim Coon, chief economist of Huntington National Bank told Reuters. "This report might be the shot that brings the market to realize that underlying inflation is higher than recently reported numbers."
But another Wall Street economist said the data was an aberration, pointing to soothing retail sales and wholesale price data released a day earlier and labor statistics earlier this month indicating that wages are flat.
"I'm not saying this doesn't mean anything," Brian Wesbury, chief economist for Griffin, Kubik, Stephens & Thompson, told CNNfn. "I just think it means less than the printed numbers have shown."
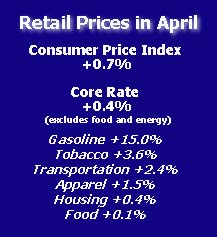
About half of the April CPI increase was attributed to soaring gasoline prices. Overall energy prices grew 6.1 percent. The food index increased 0.1 percent, following a 0.2 percent decline in April.
After the CPI data release, the benchmark 30-year bond plummeted 2 points in price to boost the yield to 5.90 percent, the highest rate since May 25, 1998. Prior to the 8:30 a.m. ET report, the bond was up 7/32 for a yield of 5.745 percent.
The sell-off in bonds continued with a report from the Federal Reserve later Friday morning a quicker-than-expected pickup in U.S. industrial output in April. Output rose 0.6 percent last month, exceeding forecasts of 0.4 percent
"It's an overreaction in a very thin market," said Daniel Fuss, portfolio manager at Loomis Sayles & Co. He said bonds are trading lower than fair value and are a cheap buy now. 
|
|
|
|
|
|
Department of Labor
|
Note: Pages will open in a new browser window
External sites are not endorsed by CNNmoney
|
|
|
|
 |

|