|
Nov. manufacturing dips
|
 |
December 1, 1999: 2:31 p.m. ET
NAPM index, inflation component slip; construction spending increases
|
NEW YORK (CNNfn) - U.S. manufacturing activity eased somewhat in November and prices paid for materials by the nation's purchasing managers fell, a trade association report showed Wednesday, an indication that the manufacturing sector may not be as robust as previously thought.
Separately, the Commerce Department said construction spending rose 0.5 percent in October, more than forecasts of no change from September.
The National Association of Purchasing Management said its index of manufacturing activity slipped to 56.2 in November from 56.6 in October, the second monthly decline and just below the 56.3 reading expected by analysts. The "prices paid" component -- a measure of costs -- declined to 65.3 from 69.4, its first drop in six months.
While the numbers were a shade weaker than expected, they remained at levels that "suggest manufacturing activity continued to expand at a moderate pace,� said Steven Wood, an economist with Banc of America Securities in San Francisco.
Peaked out?
Norbert Ore, chairman of the National Association of Purchasing Management's survey committee, reiterated that view -- suggesting that manufacturing activity, while still strong, might have peaked.
"I think it probably indicates that strength in the manufacturing sector is continuing, but we are not really gaining momentum," he said.

The NAPM manufacturing index was almost unchanged last month
The overall index has been higher than 50 since January after declining in December 1998 to 45.3. That was the lowest since May 1991, at the tail end of the last recession. A reading above 50 suggests accelerating manufacturing output.
Stocks rose and bonds recovered from earlier losses following the report�s release as investors concluded that manufacturing is beginning to show signs of tapering off, easing the threat of accelerating inflation.
Somber views
That could convince Federal Reserve policy makers to hold the line on interest rates, analysts said. The Fed last raised rates by a quarter point at its Nov. 16 meeting. While few analysts expect the Fed will raise rates again at its Dec. 21 meeting, some are forecasting a rate rise early in the new year.
Still, economists were a little more dubious, pointing out that other factors including voracious consumer spending and a still-robust real estate market are propelling the economy forward without any additional help from the manufacturing sector.
"There is no question the market likes anything that suggests the Fed might not need to tighten monetary policy,� said Charles Lieberman, chief economist with Morgan Stanley Dean Witter. "But fundamentally, the U.S. economy is growing well-above potential and the Fed needs to tighten policy to slow it down.�
The NAPM, an organization that provides information and resources for the purchasing profession, surveys some 350 of its 45,000 members each month to track economic activity in 20 industries across the U.S. Purchasing managers are the people who buy and sell the goods and services a company needs to make money.
Lower demand?
NAPM also calculates indices based on levels of production, new orders, deliveries, inventories and employment among its members, offering different perspectives on the progress of the economy.
Its production index, which measures the level of current output at the nation�s factories, declined to 57.4 in November from 58.3 in October. The new orders index, a gauge of current demand, rose to 59.9 from 59.5. The export index, a measure of international demand, rose to 54.5 in from 52.4.
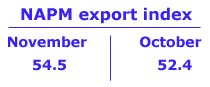
The export index measures demand abroad for U.S.-made goods
Its suppliers delivery index, which measures how much demand there is from clients to receive their goods, slipped to 55.9 from 56.6, while the inventory index, another gauge of pent-up demand, fell to 50 from 51.1. The employment index, which measures companies� hiring intentions as well as labor market conditions, fell to 52.2 from 52.8.
Financial markets follow the NAPM report closely because it offers a variety of different indicators that help them judge the pace of the economy. It is also the first report to be released each month, offering the first glimpse of how the economy is doing.
Construction up
Separately, the Commerce Department said spending on new U.S. construction projects rose 0.3 percent in October, above the revised 0.1 percent decline recorded in September and the unchanged reading expected by economists.
And in another report issued by the Conference Board, the country�s leading economic indicators were unchanged in October after declining 0.1 percent in September. Analysts had expected a 0.1 percent increase for the month. 
|
|
|
|
|
 |

|