|
Leading indicators strong
|
 |
December 29, 1999: 2:04 p.m. ET
Index up last month; economy expected to be poised for longest expansion ever
|
NEW YORK (CNNfn) - A key forecasting measure of the U.S. economy rose in November, bolstered by rising stock prices and orders for consumer goods that are expected to propel the U.S. economy to its longest expansion ever, an industry report released Wednesday showed.
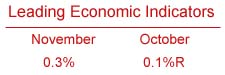
The Conference Board�s index of leading economic indicators gained 0.3 percent to 108.3 in November from a revised 0.1 percent in October, beating analysts� expectations of a 0.2 percent gain. The index, which aims to forecast the economy's progress six to nine months out, stood at 100 in 1992.
February will mark the 107th consecutive month of economic growth. The current record is 106 months of growth in the 1960s, between February 1961 and December 1969.
Six of the 10 indicators that make up the index rose. Along with the increased value of stocks and rising factory orders for consumer goods, the index was lifted by higher consumer confidence, expansion of the money supply, a rise in building permits and low numbers for initial claims for state unemployment benefits, the board said.
Offsetting the gains was a shorter factory workweek, fewer orders for capital goods, faster vendor deliveries and a narrower difference, or spread, between present and longer-term rates.
"Severe weather conditions and uncertainty over interest rates may help explain why the rise in the indicators was cut short," said Conference Board economist Ken Goldstein.
Click above for the Conference Board�s full report
The report follows on the heels of the conference board�s latest tally on consumer confidence, which shows that American consumers are as optimistic about the prospects for the economy as they have been in more than three decades.
That optimism has been fueled in large part by stock market and real estate asset gains, which have increased the paper wealth of Americans and given them more disposable income. The Nasdaq composite index has risen a record 82 percent since January, the biggest gain for any major U.S. stock index ever.
By most analysts� estimates, the U.S. economy is expected to post growth in the range of 4.5 percent to 5 percent in the final quarter of 1999 and then slow to a 4 percent to 4.5 percent pace in the first quarter of 2000, as the Federal Reserve�s three interest rate increases have their full effect on the economy.
At the same time, many analysts and economists are anticipating even more rate rises in the new year from the Fed, because the 4 percent to 4.5 percent expected pace at the beginning of the year may still lead to faster inflation. Fed policy makers last raised their benchmark Fed funds rate by a quarter point to 5.5 percent on Nov. 16. They opted to leave rates unchanged at their final meeting of the year on Dec. 21. 
|
|
|
|
|
|
The Conference Board
|
Note: Pages will open in a new browser window
External sites are not endorsed by CNNmoney
|
|
|
|
 |

|