|
New-home sales taper off
|
 |
January 6, 2000: 11:42 a.m. ET
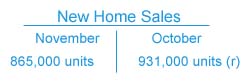
November sales fall 7.1% to 865,000 annual rate, well below estimates
|
NEW YORK (CNNfn) - Sales of new homes tapered off in November from October, according to a government report released Thursday, suggesting that climbing mortgage rates spurred by rising yields on government bonds are taking their toll on the red-hot U.S. housing market.
New-home sales slipped 7.1 percent to a seasonally adjusted annual rate of 865,000 units in November, below both analysts� estimates of 925,000 units and the revised October gain of 9 percent to 931,000 units, the Commerce Department said. November�s slide was the biggest since an 8 percent drop in December 1997.
Bonds held their gains after the report on optimism that the Federal Reserve�s spate of interest rate increases through 1999 is having an effect on consumer borrowing, thus slowing growth. Bonds prefer slower growth because it reduces the threat of accelerating inflation, which erodes their fixed value.
"Looking away from the unreliable single month's numbers to the broader trend, it is clear that new-home sales are now trending flat at best, and may be starting gradually to slide,� said Ian Shepherdson, chief U.S. economist with High Frequency Economics.
Slowing down
In mid-November the Fed lifted short-term interest rates a third time in an attempt to cool the robust U.S. economy and head-off potential inflationary pressures. The Fed's moves helped push the average 30-year mortgage to nearly 8 percent, a full percentage point above year-earlier levels.
That has put a damper on the U.S. housing market and on consumer borrowing in general, which should slow the economy and allow the Fed to hold off launching a series of interest rate hikes, Wayne Ayers, chief economist with BankBoston, told CNNfn. (584K WAV) (584KB AIFF)
Click here for the Commerce Department�s complete release on November new-home sales
Applications for new mortgages are on the decline as well, according to the Mortgage Bankers Association of America�s weekly index of applications. The index slipped to 247.5 in the week ended Dec. 31, its lowest level in 2-1/2 years. The index peaked at 488.4 last January.
"This is ultimately what counts for GDP growth, and we expect slower home sales and reduced spending on housing-related items eventually to take some 0.5 percent to 1 percent off growth this year,� Shepherdson said. "This is a key reason talk of another 75-100 basis points on the Fed funds rate is misplaced, but today's numbers alone won't stop the worrying.�
Fixed vs. variable
Indeed, the robust economy is keeping housing sales strong, even with November�s declines, prompting concern among investors that more rate increases will be needed from the Fed.
What's more, consumers are shifting to variable-rate mortgages, which typically carry a lower rate than 30-year fixed-rate loans, leading some to believe that a drop in mortgage applications isn�t properly reflecting consumer demand. The average rate on a one-year adjustable mortgage is currently just above 7 percent.
The inventory of new homes for sale rose to a 4.5-month supply in September, the highest since a 4.6-month supply recorded in May 1997, the agency said. By region, new-home sales plunged 31.5 percent in the Northeast, 7.8 percent in the Midwest, 3.1 percent in the South and 5.4 percent in the West.
Despite the slackening sales pace, house prices rose again in November. The median home price rose to a record $167,400 from $159,000 in October while the mean home price rose to a record $209,700 from $201,300 in October, an indication that Americans still were buying luxury homes. 
|
|
|
|
|
 |

|