|
McDonald's, PM miss mark
|
 |
January 26, 2000: 12:37 p.m. ET
Despite gains, firms are first on Dow to miss forecasts for latest quarter
|
NEW YORK (CNNfn) - McDonald's Corp. and Philip Morris Cos. both posted improved fourth-quarter results Wednesday, but still became the first two components of the Dow to miss analyst expectations for the period.
Despite narrowly missing forecasts, officials of the Oak Brook, Ill., fast food chain and the New York cigarette, beer and food company said they are pleased with the results and believe the outlook for the year is positive. Still, their reports were unusually disappointing in a period when most Dow components were exceeding expectations.
McDonald's posts record results
McDonald's fourth-quarter earnings, excluding the impact of currency translation, came to $486.2 million, or 35 cents a diluted share. Analysts surveyed by First Call had expected 36 cents during the period.
The earnings were a record and a 9 percent gain from the $447.1 million, or 32 cents a share before special charges a year ago. Including those charges, reported net income came to $348.5 million, or 25 cents a diluted share, a year earlier.

Corporate revenue grew 5 percent to $3.4 billion, while system-wide sales also gained 5 percent to $9.7 billion in the period. Sales grew in every region except Latin America, although even that area posted a gain when measured in constant currency.
For the year, McDonald's posted earnings excluding the effect of currency translation of $1.9 billion, or $1.39 a share, up from $1.8 billion, or $1.26 a share before charges, in 1998. Including those charges, 1998 earnings were $1.6 billion, or $1.10 a share.
Revenue for the year rose 7 percent to $13.3 billion. System-wide sales also gained 7 percent to $38.5 billion.
Cigarettes drive Philip Morris gains
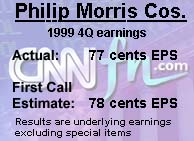
Philip Morris reported underlying fourth-quarter earnings, excluding charges and special items, of $1.81 billion, or 77 cents a share. Analysts surveyed by First Call had forecast 78 cents for the period. A year earlier, earnings on the same basis came to $1.77 billion, or 72 cents a share.
Reported net income, which includes separation costs, litigation charges, asset write-downs and incremental year 2000 sales, was $1.9 billion, or 79 cents a share, compared with $274 million, or 11 cents a share, a year ago.
Price increases for cigarettes helped push revenue for the quarter up 4.4 percent to $19.2 billion. Domestic tobacco sales rose 28 percent to $5.2 billion, overcoming a slight fall in overseas tobacco sales to $6.08 billion from $6.14 billion a year ago. Food revenue fell 4 percent to $7 billion.
For the year, the company's underlying income excluding special charges and items was $7.9 billion, or $3.30 a diluted share, up 2 percent from $7.8 billion, or $3.17 a share, in 1998.
Reported net income including all the charges came to $7.7 billion, or $3.19 a diluted share, in 1999, compared with $5.4 billion, or $2.20 a share, in 1998. Revenue for the year rose 6 percent to $78.6 billion.
Shares of McDonald's (MCD) were down 1-5/8 to 38-3/16 at midday Wednesday, while Philip Morris (MO) was off 3/4 to 21-3/16. 
|
|
|
|
|
 |

|