|
Political biz moves markets
|
 |
March 6, 2000: 11:20 a.m. ET
Elephants and donkeys both look good in the quadrennial election-year dance
By Staff Writer Alex Frew McMillan
|
NEW YORK (CNNfn) - Perhaps the only kind of coverage that will eat up more of this year's airwaves than the stock market is politics. So as Bush and McCain, Bradley and Gore take every opportunity to shove their mugs in front of the cameras, it would be nice to know what effect the candidates and elections themselves have on investors.
Is it better for the stock market if Republicans or Democrats win? Does the election cycle affect the market? Even people who don't care about politics will start paying attention if the results hit their pocketbook or their portfolio.
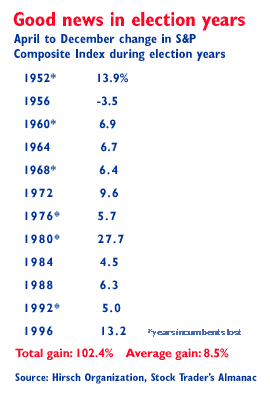
Elections keep investors happy
 The good news, according to one stock market data cruncher, is that the year will be positive whoever wins the primaries or the presidential election, and not just because the election hype will be over. The stock market will see good gains because the elections are going on. The good news, according to one stock market data cruncher, is that the year will be positive whoever wins the primaries or the presidential election, and not just because the election hype will be over. The stock market will see good gains because the elections are going on.
Why? The political world definitely imposes patterns on the stock market, according to Yale Hirsch, head of Old Tappan, N.J.-based The Hirsch Organization.
"Election years are traditionally up years," Hirsch writes in his Stock Trader's Almanac. The solution is simple -- even when there's a lame-duck president, as President Clinton is now, he wants to make sure his party retains the presidency. That means keeping the markets, and the public, happy.
In fact, the last two years of an administration see much stronger stock market performance than the first two. Since 1832, for instance, there have been 42 presidential terms. The Dow Jones industrial average has gained 703.2 percent in the combined second halves of those terms, dwarfing the 251.8 percent gains seen in the first two years.
"Incumbent administrations shamelessly attempt to massage the economy so voters will keep them in power," Hirsch finds. Federal spending, social security and real disposable income all tend to show a marked acceleration in an election year.
Each administration is a tale of two halves
The year before an election, the third year of a president's four-year term, is the best year for the market, followed by election years. Still, even though the markets have been choppy in 2000, history tells us to expect a strong end to the year.
Since 1952, the stock market lost value between January and April in five of the 12 election years. But it gained between April and December in 11 of the 12 election years.
Eventually, of course, "the piper must be paid" for the election-year excess and spending, according to Hirsch. Most big, bad bear markets started the year after an election, which posts by far the worst results in the four-year cycle. The second year of an administration is the second-worst.
Another explanation for the relative poor performance of the markets early in a term is that presidents make their most unpopular steps or biggest gambles then. Clinton, for example, needed to recover from his unsuccessful attempts to handle touchy issues such as gays in the military and substantive health-care reform.
Markets vote Republican
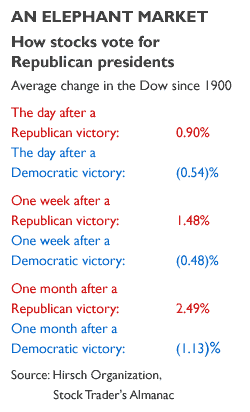
 Markets also favor GOP presidents. Since 1900, the market has risen 10 out of 13 times the day after a Republican was elected. But it rose only four of 12 times that a Democrat claimed office. Markets also favor GOP presidents. Since 1900, the market has risen 10 out of 13 times the day after a Republican was elected. But it rose only four of 12 times that a Democrat claimed office.
The Dow has also risen the following day, week and month after a Republican wins the presidency. It averages a drop the day, week and month after a Democrat takes the top job.
Whether the driving force is the party elected or the incumbents monkeying with the economy, the numbers for the market are striking. Since 1832, stock market gains as measured by leading indexes by year of each term are 75.1 percent for the first year, 176.7 percent for the second, 407.0 percent for the third and 296.2 percent for the last year, according to the Stock Trader's Almanac.
That means all the stats point in one direction this year -- up. But precedent doesn't do you any good if this year is an exception. And there's always an exception to every hard-and-fast rule.
Nice, but what's going to happen this year?
"Frankly, Yale Hirsch attaches more significance to this than he should," said Hugh Johnson, chief investment officer of the bank First Albany Corp. "Sometimes it [the market] does well in an election year and sometimes it doesn't. The real question is what is it going to do this time."
Johnson thinks the election year theory is delusional -- a little like the Super Bowl theory, which holds that the market gains when the National Football Conference team wins the Super Bowl, as the St. Louis Rams did this year. The market normally gains and the NFC has won the majority of Super Bowls. Same in an election year -- the market normally goes up. But not always.
The years 1960 and 1984 were both election years and bad for the market -- the Dow lost 9.3 percent when John F. Kennedy was elected in 1960 and lost 3.7 percent when Ronald Reagan was re-elected in 1984. Both times, the Federal Reserve was leaning toward restraint, and domestic liquidity with the money supply was deteriorating.
"That's the situation today," Johnson said. "Since that's the case, I'd be more inclined to think this will be a negative year than a positive year."
Attempts to bolster the economy can and do backfire, too, like they did after Nixon was re-elected in 1972. The Dow gained 14.6 percent that year as the Federal Reserve kept interest rates low, a move many economists now agree was a mistake. As a result, the Dow fell 16.6 percent in 1973 and 27.6 percent in 1974 as inflation ran rampant.
Standing on the shoulders of giants
Because the trends are general and each specific year produces results based on different specific situations, Johnson says there's no way you can count on the election-year effect. "If you find that [the effect] useful, go ahead and use it. I wouldn't use it to drive portfolio policy," he said.
Presidencies build on each other, while the stats look at distinct years. So administrations don't always determine their own fates. George Bush lost in 1992, burdened by a bad economy, only for it to rebound in time for Clinton to take office. Some economists say the bull years of the Clinton presidency are built on the back of "Reaganomics" and even the deregulation Jimmy Carter started in his tenure.
"We're not taking a clean coin and flipping it over and over again," said Warren Bailey, associate professor of finance at Cornell University's Johnson Graduate School of Management. He said that there are too many factors to control for and too many different circumstances -- whether the Congress is dominated by the same party as the presidency, for instance - to determine any specific trends.
Even the party elected isn't that meaningful, he said. The two parties have moved closer together economically in recent years. And they've acted to counter to what is typically expected from them -- while Richard Nixon pursued a very un-Republican, intrusive economic policy, Clinton has presided over the end of the budget deficit, something unexpected of a Democrat in the White House.
Bailey has had numerous students study the political effects of politics on the stock market. His conclusion is that, for the most meaningful period to look at, the post-World War II period, there simply isn't enough data to detect patterns that are useful, though it seems to make sense they're there.
"It's sort of like religion," he said. "It's something we can think about, and it's very interesting. But not something we can prove."
He does, however, buy into the theory that incumbent presidencies try to manipulate the markets. "You would hope that something like that doesn't go on in America and would only go on in a banana republic," he said. "But let's face it. It does go on in America." But the results are unpredictable.
Specific sectors see the most effect
The most dramatic effects, and the only ones market watchers pay attention to, come in specific sectors. For instance, health care, aerospace and tobacco would likely come under pressure if the current administration succeeds in getting Al Gore elected. On the flipside, environmental-services companies might benefit.
So the economic picture is "one out of the 100 or more things you might look at," said Dick McCabe, chief market analyst with Merrill Lynch. It's always there in the background. Sometimes the effect is dramatic. But the normal market stats - - money flowing into the markets, advances versus declines, the trends of main sectors -- are more significant. "You put it into the whole pie," he said.
Tom Galvin, chief investment officer of Donaldson Lufkin & Jenrette, said there's one factor you can count on this year -- that the Federal Reserve will not raise interest rates in October or immediately around the election, to avoid being a direct factor. He is watching the effect of the election on the health-care industry because Democrats will play the Medicare card to get the seniors' vote, he said, which could have a negative effect on drug stocks.
Other than that, he shares the skepticism of many on Wall Street and the business world about what goes on in Washington. "At this point, politicians can only screw it up, because things are going so well," Galvin said. "I try not to spend more than five minutes a year on politics." 
-- Got questions about financial planning? Need some advice? CNNfn.com has organized a panel of outside experts to answer your questions. If you want to be considered for our "Checks and Balances" column, where professional planners suggest ways you can manage your money, send us an e-mail at consumer@cnnfn.com. Include information about your age, occupation, income and assets. Also, share with us any short-term and long-term financial goals you may have. And don't forget to leave your phone number.
|
|
|
|
|
 |

|

