|
Existing home sales rise
|
 |
March 27, 2000: 11:24 a.m. ET
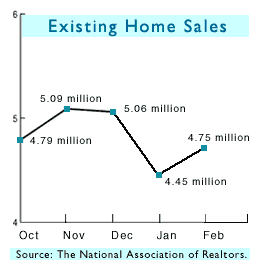
February figures up 6.7% to 4.75M annual rate, in line with analysts' forecasts
|
NEW YORK (CNNfn) - U.S. sales of existing homes rose for the first time in three months in February, a real estate group reported Monday, just a month after registering the largest decline in almost five years and in the face of rising borrowing costs.
Sales of existing homes gained 6.7 percent last month to a 4.75 million annual rate, the National Association of Realtors said, matching the pace analysts had expected. In January, sales fell a revised 13.4 percent to 4.45 million. Sales declined 7.6 percent from a year ago.
February's rise in sales came as the rate on the average 30-year mortgage rose to 8.33 percent from 8.21 percent in January, and up from 6.81 percent in February 1999. At the same time, optimism among consumers that housing prices will continue to rise helped propel the market forward, even as borrowing costs rose, the Washington-based agency said.
The median price of an existing home was $131,100 in February, down slightly from the $132,200 recorded in January though higher than the $128,100 of a year earlier. The median sales price is the midpoint, where half the homes sold for more and half for less.
Slowing sales expected
Most analysts expect that higher interest rates will continue to dampen enthusiasm in the U.S. housing market, keeping sales in line.
 "The burden of higher interest rates will weigh down the housing industry further," said Steven Wood, an economist with Banc of America Securities in San Francisco. "This, in turn, should lead to moderated residential construction and home related consumer spending on goods such as furniture, appliances, and home improvement items in coming months." "The burden of higher interest rates will weigh down the housing industry further," said Steven Wood, an economist with Banc of America Securities in San Francisco. "This, in turn, should lead to moderated residential construction and home related consumer spending on goods such as furniture, appliances, and home improvement items in coming months."
Others including J.P. Morgan economist Jim O'Sullivan expect it will take more work from Federal Reserve policy makers to ensure that interest rates rise to a level that prompts consumers to think twice about signing on the dotted line. O'Sullivan is expecting at least three more interest rate increases from the Fed before the end of the year.
The Fed has raised short-term rates five times since last June -- most recently on March 21st when it lifted its trend-setting fed funds rate a quarter point to 6 percent. Higher rates and concerns about inflation have pushed up bond yields in recent months, which are directly tied to mortgage rates.
South leads the pack
In late morning trading Monday, the 30-year Treasury bond was down 1/4 of a point in price, raising its yield to 6 percent from 5.97 percent late Friday. The 10-year note was down 11/32 of a point in price, raising its a yield to 6.23 percent from 6.19 percent late Friday.
Sales in the South led the pack in February, with a 10.7 percent rise. Sales in the West gained 8.7 percent while sales in the Midwest rose 5.7 percent. Sales in the Northeast contracted by nearly 7 percent. The supply of homes for sale grew to 2.8 months from a record low of 2.6 months in January.
The report is a closely watched indicator of the economy in general and the interest-rate sensitive housing market in particular because previously owned homes account for about 85 percent of all houses on the market.
Existing home sales figures are based on closings, which usually come one to two months after a homebuyer signs on the dotted line. That means sales are affected more by changes in mortgage rates that occurred a month or two earlier, because most financial institutions will allow the buyer to obtain their mortgage at the lower rate that existed when they agreed to buy the home. 
|
|
|
|
|
 |

|