NEW YORK (CNNfn) - Treasury bonds rallied Thursday, pulling yields to a seven-month low as investors sought a safe haven in government securities amid plunging U.S. technology stocks.
In late trade, the tech-oriented Nasdaq composite index fell more than 4 percent, extending Wednesday's sharp losses. The "flight to quality" movement began overnight from weak global equity markets.
"That initial flight to quality bid on the back of softer overseas equity markets has been present all day," said Joe LaVorgna, senior U.S. economist at Deustche Bank Securities.
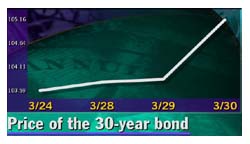
Shortly after 3 p.m. ET, the 30-year bond rose 1-10/32 points to 105-5/32. Its yield, which moves inversely to its price, fell to 5.88 percent - its lowest level since late August -- from 5.98 percent Wednesday. Ten-year Treasury notes gained 20/32 to 103-3/32, their yield falling to 6.07 percent from 6.17 percent Wednesday.
The bond market often benefits from weakness in equities, as investors reallocate money from volatile stocks to the relative safety of government securities.
In addition, weakness among corporate and agency securities, so called "spread product," also provided support early in the session. Analysts noted there was continued uncertainty about the agency debt market following U.S. Treasury undersecretary Gary Gensler's testimony last week before Congress in which he supported a bill that would effectively diminish the perception that agency securities are fully backed by the U.S. government.
Economic news discounted
A government report showing continued strength in the economy had little impact. U.S. gross domestic product (GDP), a measure of goods and services domestically produced, was revised up to a 7.3 percent annual rate in the fourth quarter from the previously reported 6.9 percent, according to the Commerce Department.
However, the price deflator, a key inflation gauge, rose 1.9 percent, suggesting inflation was contained.
With a buoyant U.S. economy, concerns about inflationary pressures pressure the market. The Federal Reserve has hiked rates five times since June in an effort to slow the economy, each time by a quarter percentage point in a "gradualist" manner.
Yet consumer demand remains strong, and some market participants fear more aggressive tightening in the near term, such as a half percentage point (50 basis points). The next monetary policy meeting is scheduled May 16.
But Michael Boss, bond futures trader at IBJ Lanston Futures, told CNNfn's market coverage he doubted the Fed will boost rates by 50 basis points.
(176.4K WAV) (176.4 AIFF)
In other economic news, U.S. jobless claims rose 3,000 to 266,000 for the week ended March 25. Despite the increase, the report indicates a continued tight labor market.
Dollar weakens
The dollar fell against the major currencies Thursday. Shortly after 3 p.m. ET, the euro traded at 96.11 cents, up from 95.34 cents Wednesday, a 0.8 percent loss in the dollar's value.������ ����
Meanwhile, the dollar traded at 105.48 yen, down from 105.76 yen Wednesday, a 0.3 percent loss in the dollar's value. 
|