|
U.S. manufacturing slows
|
 |
April 3, 2000: 1:06 p.m. ET
NAPM index dips to 55.8 in March; February construction spending surges
By Staff Writer M. Corey Goldman
|
NEW YORK (CNNfn) - U.S. manufacturing activity gained at a slightly slower pace in March while prices paid for materials surged to its highest in more than five years, a trade report showed Monday, suggesting producers are turning out slightly fewer goods, yet paying more to their suppliers.
Construction spending, meanwhile, advanced at a faster-than-expected pace, according to a separate, government-issued report.
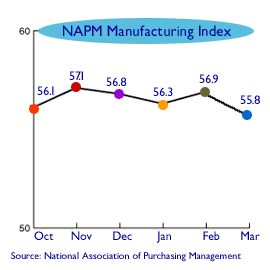
 The National Association of Purchasing Management said its index of manufacturing activity slipped to 55.8 in March from 56.9 in February, below the 56.5 reading expected by analysts. A reading of 50 or higher typically indicates accelerating activity. The overall index has been at 50 or higher since February 1999. The National Association of Purchasing Management said its index of manufacturing activity slipped to 55.8 in March from 56.9 in February, below the 56.5 reading expected by analysts. A reading of 50 or higher typically indicates accelerating activity. The overall index has been at 50 or higher since February 1999.
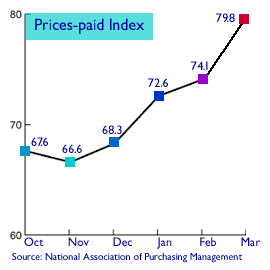
Still, the "prices paid" component -- a measure of costs -- jumped from 74.1 in February to 79.8 in March, its highest reading since an 81.7 figure in February 1995.
The numbers confirmed that U.S. manufacturing activity is still going strong, but also shows that costs for manufacturers are rising, a situation that could lead to higher prices as producers pass on their rising costs to consumers. At the same time, analysts suggest that rising prices for raw materials -- namely oil -- was behind much of the rising costs, but those increases could still place pressure on some producers to lift their prices.
Some price pressures
"While perhaps showing some retrenchment in manufacturing activity, the data nevertheless reveal that there are price pressures perhaps building in the pipeline," said Kevin Flanagan, a fixed-income strategist with Morgan Stanley Dean Witter. "I think right now it keeps the Fed on their toes and does not dissuade at all the argument that they will consider tightening again in May."
 The NAPM, an organization that provides information and resources for the purchasing profession, surveys some 350 of its 45,000 members each month to track economic activity in 20 industries across the United States. Purchasing managers are the people who buy and sell the goods and services a company needs to produce its final products. The NAPM, an organization that provides information and resources for the purchasing profession, surveys some 350 of its 45,000 members each month to track economic activity in 20 industries across the United States. Purchasing managers are the people who buy and sell the goods and services a company needs to produce its final products.
Indeed, most economists expect the Federal Reserve to raise short-term interest rates at its next policy meeting May 16 - which would be the sixth increase since June -- to reign in the economy and keep inflation in check. The fed funds rate -- the target rate for overnight loans between banks -- is currently 6 percent.
Nevertheless, the one notably absent ingredient in the current U.S. economic outlook has been accelerating inflation. Consumer prices rose a scant 0.2 percent in February, excluding volatile food and energy costs.
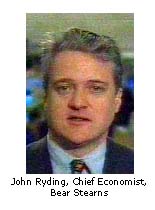
John Ryding, chief economist with Bear Stearns, told CNNfn that even with the increase in prices paid, he doesn't expect inflation to accelerate because producers absorb their higher costs.
Disinflation?
Moreover, with the Fed's recent spate of rate increases and the rising price of oil, Ryding suspects that disinflation -- where prices actually decline rather than rise -- could become a factor for the Fed. (488KB WAV) (488KB AIFF)
 One of the reasons the U.S. economy has been able to chug along at such a fast pace without spurring inflation has been the notable improvement in worker productivity. Everything from faster computer chips to automated assembly lines to the ever-expanding use of the Internet is allowing people to work more efficiently and providing companies with the ability to streamline their operations and keep their costs low. One of the reasons the U.S. economy has been able to chug along at such a fast pace without spurring inflation has been the notable improvement in worker productivity. Everything from faster computer chips to automated assembly lines to the ever-expanding use of the Internet is allowing people to work more efficiently and providing companies with the ability to streamline their operations and keep their costs low.
At the same time, very few analysts, and particularly Fed Chairman Alan Greenspan, agree that the economy can keeping growing at a pace that is almost double what is considered a comfortable and non-inflationary pace. The U.S. economy expanded at a 7.3 percent pace in the fourth quarter of 1999, its strongest showing in almost 16 years.
New orders decline
The NAPM's new orders index, which measures current demand, slipped to 56.9 in March from 60.4 in February. Its production index, which measures the current pace of manufacturing output, rose to 61.8 from 55.9, while its index of order backlogs declined to 51.0 from 54.0. 
Its suppliers' delivery index, which measures how much demand there is from customers to receive their goods, fell to 54.1 from 55. Its inventory index, another gauge of pent-up demand, rose to 48.4 from 45.2, while its employment index, which measures companies' hiring plans as well as labor market conditions, slipped to 51.5 from 53.2 in February.
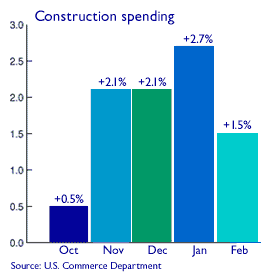
Separately, construction spending advanced at a faster-than-expected pace in February, rising 1.5 percent to a record $758.7 billion, the Commerce Department said. Analysts polled by Briefing.com had anticipated a 0.2 percent gain. January's spending was revised downward to a 2.2 percent gain from an originally reported 2.7 percent increase, the Commerce Department said.
"While a portion of this strength is due to unseasonably mild winter weather, it is obvious that higher interest rates are, so far, having little dampening impact on construction," said Steven Wood, an economist with Banc of America Securities in San Francisco. 
|
|
|
|
|
 |

|

