|
Gillette 1Q beats estimates
|
 |
April 20, 2000: 12:05 p.m. ET
Personal care products maker posts per-share profit flat from year-ago figure
|
NEW YORK (CNNfn) - Gillette Co. reported a first-quarter profit Thursday that beat Wall Street's expectations, but which was flat compared with the year-ago per-share figure.
For the first quarter, the Boston-based personal care products maker reported net income of $258 million, or 24 cents a share, compared with net income of $269 million, or 24 cents a share, in the year-earlier quarter.
The company's earnings beat the 22 cents a share predicted by analysts in a survey by earnings tracker First Call/Thomson Financial.
The maker of razor blades, Braun electric shavers and Oral-B toothbrushes posted revenue for the quarter of $2.05 billion, a 5 percent increase from the $1.94 billion in the year-earlier quarter.
While sales from blades and razors rose 10 percent and Braun products rose 14 percent, sales of stationary products declined 4 percent and Duracell batteries sales fell 2 percent for the quarter, the company said. Toiletries sales rose 2 percent and sales of the Oral-B toothbrush rose 8 percent.
 "We made substantial progress on several fronts during the first quarter," said Michael Hawley, Gillette's chairman and chief executive officer. "We generated good sales growth, as double-digit gains for blades and razors and Braun more than offset softness in certain battery markets and a significant unfavorable exchange effect." "We made substantial progress on several fronts during the first quarter," said Michael Hawley, Gillette's chairman and chief executive officer. "We generated good sales growth, as double-digit gains for blades and razors and Braun more than offset softness in certain battery markets and a significant unfavorable exchange effect."
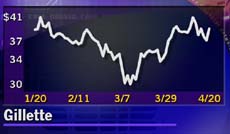
Shares of Gillette (G: Research, Estimates) gained 1-7/8 to 39 in late-morning trading on the New York Stock Exchange Thursday. 
|
|
|
|
|
|
Gillette
|
Note: Pages will open in a new browser window
External sites are not endorsed by CNNmoney
|
|
|
|
 |

|