graphic
News > Companies
Priceline beats 1Q forecast
April 24, 2000: 7:21 a.m. ET

Strong revenue, customer growth lead to smaller-than-expected loss in period
graphic
graphic graphic
graphic
NEW YORK (CNNfn) - Consumer Web site Priceline.com Inc. reported a smaller-than-forecast loss in the first quarter, as revenue and customers at the auction site continued to rise.
    The company, which allows consumers to bid for products from airline tickets to groceries, posted a loss of $7.3 million, or 4 cents a diluted share, excluding special items. Analysts surveyed by earnings tracker First Call forecast it would lose 6 cents a share in the period. The company lost $16.8 million, or 12 cents a diluted share, excluding special items in the year-earlier period.
    graphicIncluding those special items, the company lost $13.6 million, or 8 cents a diluted share, in the most recent quarter, down from $25.5 million, or 27 cents a diluted share a year earlier.
    The company had a gross profit, which it defines as revenue less the cost of products, of $49.0 million, up 752 percent from the $5.8 million gross profit a year earlier, while the gross profit margin improved to 15.6 percent from 11.6 percent a year earlier.
    Revenue rose to $313.8 million in the quarter, more than six times the $49.4 million level of a year earlier. The company said it added a record 1.5 million new customers in the quarter, bringing its total customer base to 5.3 million.
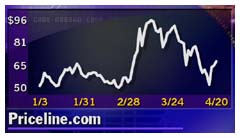
    Shares of Priceline.com rose 2-13/16 to 67-7/8 in trading Thursday. Back to top

  RELATED STORIES

Priceline.com offers "name your own" mortgage - Mar. 27, 2000

Priceline.com beats forecasts - Jan. 27, 2000

  RELATED SITES

Priceline.com


Note: Pages will open in a new browser window
External sites are not endorsed by CNNmoney


graphic


Most stock quote data provided by BATS. Market indices are shown in real time, except for the DJIA, which is delayed by two minutes. All times are ET. Disclaimer. Morningstar: © 2018 Morningstar, Inc. All Rights Reserved. Factset: FactSet Research Systems Inc. 2018. All rights reserved. Chicago Mercantile Association: Certain market data is the property of Chicago Mercantile Exchange Inc. and its licensors. All rights reserved. Dow Jones: The Dow Jones branded indices are proprietary to and are calculated, distributed and marketed by DJI Opco, a subsidiary of S&P Dow Jones Indices LLC and have been licensed for use to S&P Opco, LLC and CNN. Standard & Poor's and S&P are registered trademarks of Standard & Poor's Financial Services LLC and Dow Jones is a registered trademark of Dow Jones Trademark Holdings LLC. All content of the Dow Jones branded indices © S&P Dow Jones Indices LLC 2018 and/or its affiliates.

Most stock quote data provided by BATS. Market indices are shown in real time, except for the DJIA, which is delayed by two minutes. All times are ET. Disclaimer. Morningstar: © 2018 Morningstar, Inc. All Rights Reserved. Factset: FactSet Research Systems Inc. 2018. All rights reserved. Chicago Mercantile Association: Certain market data is the property of Chicago Mercantile Exchange Inc. and its licensors. All rights reserved. Dow Jones: The Dow Jones branded indices are proprietary to and are calculated, distributed and marketed by DJI Opco, a subsidiary of S&P Dow Jones Indices LLC and have been licensed for use to S&P Opco, LLC and CNN. Standard & Poor's and S&P are registered trademarks of Standard & Poor's Financial Services LLC and Dow Jones is a registered trademark of Dow Jones Trademark Holdings LLC. All content of the Dow Jones branded indices © S&P Dow Jones Indices LLC 2018 and/or its affiliates.