|
Tokyo avoids Asian slump
|
 |
April 24, 2000: 5:52 a.m. ET
Nikkei gains 1.3% on index changes; Singapore, Korea slump on tech sell-off
|
LONDON (CNNfn) - Japan bucked the trend in a weak session among Asian stock markets Monday, as Tokyo's blue-chip share index climbed more than 1 percent on the first day of trading for 30 new members.
Tokyo's benchmark Nikkei 225 closed up 227.47 points, or 1.25 percent at 18,480.15, recovering ground after the sharp slide in the final minutes of trade Friday when the market closed down almost 4 percent.
The first reshuffle of the benchmark index in almost 10 years provided some momentum for the market, though some of the 30 new entrants were lower after being described as overbought by traders. The index closed some 500 points below its session peak of 18,987.
Singapore's Straits Times index ended 1.47 percent lower at 2,049.78 following a late sell-off among financial and tech stocks.
Markets in Hong Kong and Sydney were both closed for public holidays, and volumes at all of the major exchanges were subdued, with little direction after the closure of U.S. and European markets Friday.
 In Tokyo, the Nikkei's new faces had a mixed reception, with NTT Data greeted warmly with a gain of almost 12 percent. NTT DoCoMo, the country's largest mobile-phone operator, ended 0.9 percent lower. In Tokyo, the Nikkei's new faces had a mixed reception, with NTT Data greeted warmly with a gain of almost 12 percent. NTT DoCoMo, the country's largest mobile-phone operator, ended 0.9 percent lower.
Advantest, a maker of electrical machinery, rose 1.9 percent. The company has the largest weighting on the Nikkei 225.
Among established Nikkei components, auto shares were broadly higher, with Honda Motor the best performer as its shares climbed 9 percent. Among the banks, Sanwa Bank made the best showing as it climbed 6 percent after unveiling plans to start an online operation. Consumer electronics maker Sony Corp. gained 3.3 percent.
Some Nikkei new entrants slumped after climbing last week when their promotion to the main index was announced. Kao Corp, a cosmetics maker, fell 12 percent and Eisai Corp., a pharmaceutical company, lost 10 percent.
Hikari tumbles again
Japan's leading Internet investors had sharply contrasting fortunes. Poor financial results from Hikari Tsushin saw its stock slump a further 9 percent as it forecast an ¥11.6 billion operating deficit ($110 million) in the year ending in August from an earlier forecast of an ¥8 billion profit.
Softbank, which has also fallen sharply over the past two months, gained 9 percent, helped by the announcement of new investments in Malaysia.
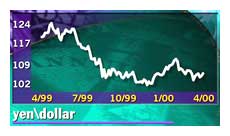 The currency markets were also subdued with European markets closed for the Easter break. The euro was trading at $0.9389 while the yen was little changed from its Friday close at ¥105.73. The currency markets were also subdued with European markets closed for the Easter break. The euro was trading at $0.9389 while the yen was little changed from its Friday close at ¥105.73.
Among smaller markets, Taiwan's TAIEX index slumped 3.43 percent to 8,808.09 as chipmakers lost ground and many of the index heavyweights went ex-dividend.
In Seoul, the Kospi index shed 2.55 percent to end at 747.58, with telecom and tech stocks losing ground. Kuala Lumpur's KLSE Composite fell 1.23 percent to close at 887.88, but other smaller markets made modest gains.
The JSX index in Jakarta added 0.85 percent to end at 530.85, the Set 50 in Bangkok closed nearly unchanged at 395.00 and Manila's PHS Composite closed up 0.5 points at 1,664.46. 
-- from staff and wire reports
|
|
|
|
|
 |

|