LONDON (CNNfn) - Asia's major stock markets turned in another weak performance on Tuesday, with Tokyo's blue-chip index losing ground for the fifth straight session as disappointing corporate earnings added to the downward pressure from another slip in U.S. markets.
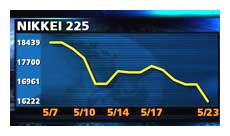
Tokyo's benchmark Nikkei 225 closed down 67 points, or 0.4 percent, at 16,318.73 as technology stocks fell in the wake of another volatile session on the Nasdaq composite, leaving the Nikkei at an 11-month low.
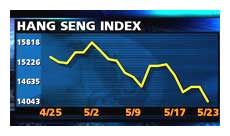
In Hong Kong, the Hang Seng staged a late recovery to close up 0.82 percent at 14,257.18, after spending most of the day in the red, bottoming at 13,980.
Singapore's Straits Times also gained towards the end of its session, though it remained 1.4 percent down near the end of its trading day as its technology components lost ground.
On Wall Street Monday, the Nasdaq composite closed down 0.8 percent, its fourth straight decline, after plunging as much as 6 percent earlier in the session. The Dow Jones industrial average also dropped 0.8 percent and the broader S&P 500 lost 0.44 percent.
 In Tokyo, NTT Data was the most significant decliner as it tumbled 13.8 percent after the unit of Nippon Telegraph and Telephone posted a 12.9 percent fall in full-year net earnings and warned that operating profit was likely to slip in the financial year ending Mar. 31, 2001. In Tokyo, NTT Data was the most significant decliner as it tumbled 13.8 percent after the unit of Nippon Telegraph and Telephone posted a 12.9 percent fall in full-year net earnings and warned that operating profit was likely to slip in the financial year ending Mar. 31, 2001.
Technology and electronics shares lost ground, with Sony falling 2.7 percent and Toshiba ending 1.3 percent lower.
Automaker Nissan Motor, which escaped Monday's sharp selloff after posting upbeat earnings last week, slid 2.2 percent Tuesday.
Brokerages that have lost ground on fears that a falling stock market would� hit earnings continued to slide. Nomura Securities ended 4.5 percent lower.
The Nasdaq's seesaw session also took its toll on Japan's two highest-profile Internet-related stocks, with investor Softbank losing 7.2 percent and Hikari Tsushin, a mobile-phone firm with significant Web assets, down 5 percent.
 In Hong Kong, China Telecom closed up almost 3 percent, recovering from a loss earlier in the day. TV operator TVB gained 3.1 percent as investors moved in on stocks that had fallen sharply in recent sessions. In Hong Kong, China Telecom closed up almost 3 percent, recovering from a loss earlier in the day. TV operator TVB gained 3.1 percent as investors moved in on stocks that had fallen sharply in recent sessions.
Banks were also firmer, with HSBC Holdings up 0.6 percent and Hang Seng Bank rising 2.7 percent.
In Seoul, the Kospi index suffered another sell-off as the chipmakers that make up much of the index continued to weaken. The index closed down 1.56 percent at 680.79 while Samsung Electronics, the world's largest maker of memory chips, ended 4 percent lower.
 Sydney's S&P/ASX200 index bucked the regional trend as it closed up 0.64 percent at 3,021.40, lifted by strong gains among mining stocks. Sydney's S&P/ASX200 index bucked the regional trend as it closed up 0.64 percent at 3,021.40, lifted by strong gains among mining stocks.
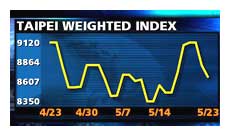
Taiwan's TAIEX index closed down 1.55 percent at 8,671.01 in thin trade, with chipmaker TSMC losing 3.2 percent.
The Set 50 in Bangkok was 1.4 percent lower in late afternoon trading, touching its lowest level in a year. Kuala Lumpur's KLSE Composite closed down 1.5 percent lower and the JSX index in Jakarta lost 0.94 percent.
Manila's PHS Composite dropped 0.5 percent to 1,404.67, recovering from session lows below 1,400, amid concern over the slump in the value of the peso and a deteriorating domestic political situation. 
-- from staff and wire reports
|
